Tenkan-sen and kijun-sen measure the short term TREND and the short term SUPPORT.
Tenkan-sen following price indicates the trend is strong
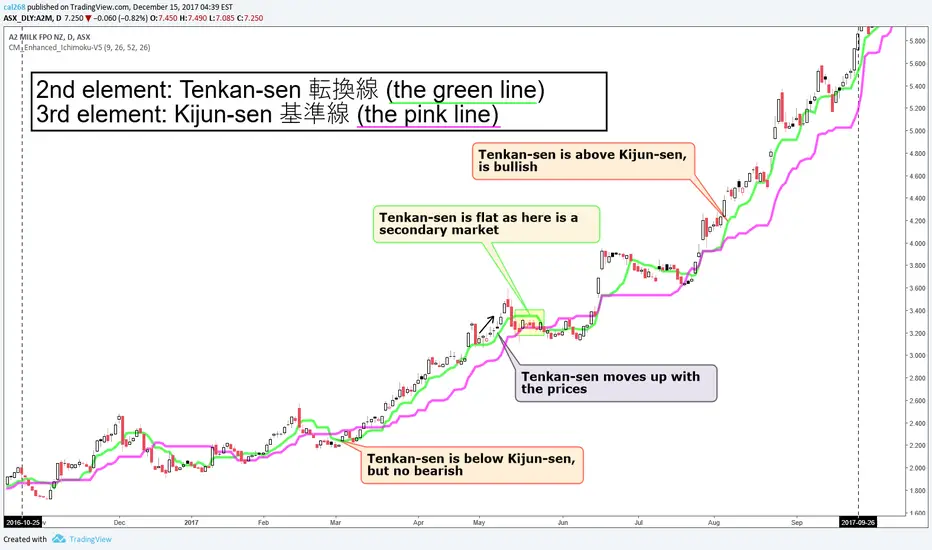
Tenkan-sen is FLAT the price is consolidating or not Trending
First observation of the Tenkan-sen is if the line is above or below the Kijun-sen
Tenkan-sen is the highest and lowest price over the past 9 periods divided by 2
It is the first level of support and resistance
Kijun-sen is the highest and lowest price over the past 26 periods divided by 2
It is the second level of support and resistance
Remember: Tenkan-sen and Kijun-sen are not moving averages.
It is arguly to declare:
When Tenkan-sen is above Kijun-sen, it is trending upward (BULLISH)
When Tenkan-sen is below Kijun-sen, it is trending downward (BEARISH)
Tenkan-sen following price indicates the trend is strong
Tenkan-sen is FLAT the price is consolidating or not Trending
First observation of the Tenkan-sen is if the line is above or below the Kijun-sen
Tenkan-sen is the highest and lowest price over the past 9 periods divided by 2
It is the first level of support and resistance
Kijun-sen is the highest and lowest price over the past 26 periods divided by 2
It is the second level of support and resistance
Remember: Tenkan-sen and Kijun-sen are not moving averages.
It is arguly to declare:
When Tenkan-sen is above Kijun-sen, it is trending upward (BULLISH)
When Tenkan-sen is below Kijun-sen, it is trending downward (BEARISH)
Related publications
Disclaimer
The information and publications are not meant to be, and do not constitute, financial, investment, trading, or other types of advice or recommendations supplied or endorsed by TradingView. Read more in the Terms of Use.
Related publications
Disclaimer
The information and publications are not meant to be, and do not constitute, financial, investment, trading, or other types of advice or recommendations supplied or endorsed by TradingView. Read more in the Terms of Use.