Pros
Trading at 68% below its fair value Earnings are forecast to grow 29% per year
AAL returned 33.2% last week AAL is good value based on its PE Ratio (3.3)
AAL is good value based on its PEG Ratio (0.1)
AALs Return on Equity is forecast to be very high in 3 years' time.
AALs dividend (3.2%) is higher than the bottom 25% of dividend payers in the US market (1.82%)
During the past 3 Months, Insiders have bought 54000 shares (approx $1.1m)
Cons
AALs Debt is not well covered by operating cash flow
Has an unstable dividend track record Highly volatile share price over the past 3 months
Down 63.9% over the last year
AALs revenue is forecasted to grow slower than the US market per year
AAL had a large 1 off loss of $652.0M impacting its December 31, 2019, financial results
AALs earnings have declined by -31.8% per year over the past 5 years
AAL has negative shareholder equity, which is more serious than a high level of debt
Banks/Funds have been downgrading AAL
Report:
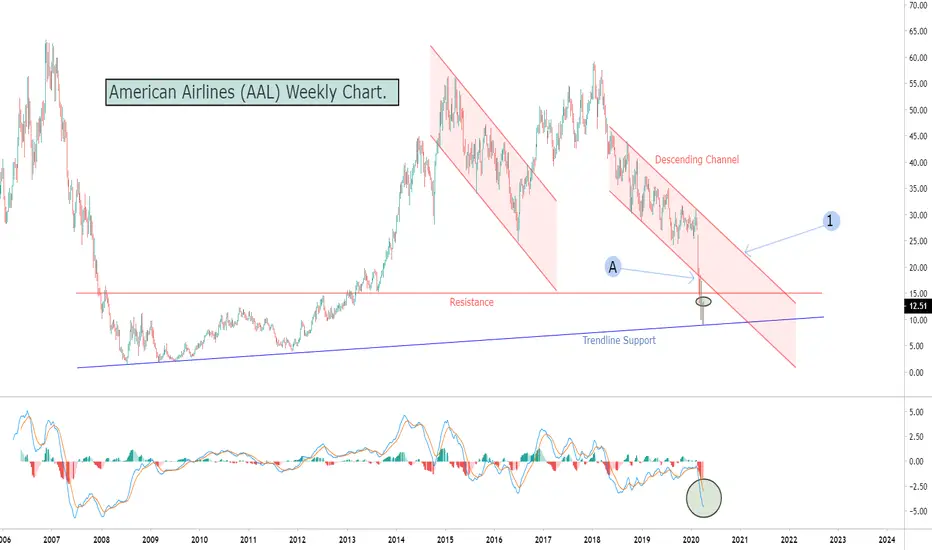
From a technical standpoint, rising trendline support held at 886, however, we broke sharply out of the descending channel at (A) to the downside which we really need to get back inside and stay above resistance at (1). A break out of the descending channel to the upside and above resistance would be considered a buy signal (based on chart pattern analysis). Technical Indicators are showing early signs of curling, which 'could' suggest that the bottom is in. But further confirmation of this is necessary. From a Fundamental standpoint, the data is mixed (as listed above).
Bottomcatchers Opinion:
In our opinion, the mixed fundamental data is slightly skewed positive, which suggests future growth looks promising. However, the technical chart is showing a risk/reward ratio that's skewed negatively (at this stage). That's not to say this security is not a good buy, it simply means caution is needed. Buying above resistance which comes in at 1503 would be considered an aggressive buy, but one that could play out providing we stay above resistance. A break out of the descending channel to the upside would be good confirmation that we are probably in an uptrend. So with all the information, we have to work with, my call for this trade would be to buy above resistance and use the resistance level (which would become support at 1503) as a stop loss area. Further buying opportunities would present themselves above the top descending channel trendline at (1). With a target at September 2016 lows, which comes in at 3392. Time Frame for this trade set-up is medium to long term.
Trading at 68% below its fair value Earnings are forecast to grow 29% per year
AAL returned 33.2% last week AAL is good value based on its PE Ratio (3.3)
AAL is good value based on its PEG Ratio (0.1)
AALs Return on Equity is forecast to be very high in 3 years' time.
AALs dividend (3.2%) is higher than the bottom 25% of dividend payers in the US market (1.82%)
During the past 3 Months, Insiders have bought 54000 shares (approx $1.1m)
Cons
AALs Debt is not well covered by operating cash flow
Has an unstable dividend track record Highly volatile share price over the past 3 months
Down 63.9% over the last year
AALs revenue is forecasted to grow slower than the US market per year
AAL had a large 1 off loss of $652.0M impacting its December 31, 2019, financial results
AALs earnings have declined by -31.8% per year over the past 5 years
AAL has negative shareholder equity, which is more serious than a high level of debt
Banks/Funds have been downgrading AAL
Report:
From a technical standpoint, rising trendline support held at 886, however, we broke sharply out of the descending channel at (A) to the downside which we really need to get back inside and stay above resistance at (1). A break out of the descending channel to the upside and above resistance would be considered a buy signal (based on chart pattern analysis). Technical Indicators are showing early signs of curling, which 'could' suggest that the bottom is in. But further confirmation of this is necessary. From a Fundamental standpoint, the data is mixed (as listed above).
Bottomcatchers Opinion:
In our opinion, the mixed fundamental data is slightly skewed positive, which suggests future growth looks promising. However, the technical chart is showing a risk/reward ratio that's skewed negatively (at this stage). That's not to say this security is not a good buy, it simply means caution is needed. Buying above resistance which comes in at 1503 would be considered an aggressive buy, but one that could play out providing we stay above resistance. A break out of the descending channel to the upside would be good confirmation that we are probably in an uptrend. So with all the information, we have to work with, my call for this trade would be to buy above resistance and use the resistance level (which would become support at 1503) as a stop loss area. Further buying opportunities would present themselves above the top descending channel trendline at (1). With a target at September 2016 lows, which comes in at 3392. Time Frame for this trade set-up is medium to long term.
Disclaimer
The information and publications are not meant to be, and do not constitute, financial, investment, trading, or other types of advice or recommendations supplied or endorsed by TradingView. Read more in the Terms of Use.
Disclaimer
The information and publications are not meant to be, and do not constitute, financial, investment, trading, or other types of advice or recommendations supplied or endorsed by TradingView. Read more in the Terms of Use.