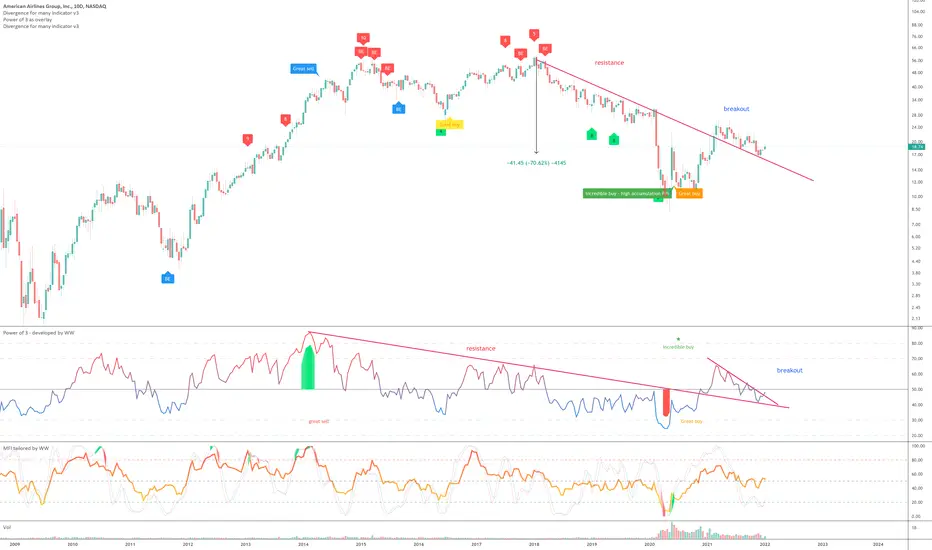
The last 4 years have been brutal for American Airlines. That’s about to change, time to get onboard (I’ll get me coat… )
On the above 10-day chart price action has collapsed 70%. A number of reasons now exist to be bullish, including:
1) Price action resistance breakout.
2) A ‘incredible buy’ signal prints.
3) RSI resistance breakout. Followed by the RSI falling wedge breakout. Excellent.
4) A Dragonfly DOJI candle printed on the monthly chart (below) as price action consolidates within a falling wedge pattern.
Is it possible price action falls further? Sure.
Is it probable? No.
Entry: $20 and above.
Stop: $16
Target: $34
Good luck!
WW
Monthly chart
Trade active
New target: $55Trade active
Massive dragonfly DOJI candle prints on the monthly chart. Should be Jet A1 but this is rocket fuel.BTC
bc1q2eckdzh0q8vsd7swcc8et6ze7s99khhxyl7zwy
Weblink: patreon.com/withoutworries
Allow 3-6 months on ideas. Not investment advice. DYOR
bc1q2eckdzh0q8vsd7swcc8et6ze7s99khhxyl7zwy
Weblink: patreon.com/withoutworries
Allow 3-6 months on ideas. Not investment advice. DYOR
Disclaimer
The information and publications are not meant to be, and do not constitute, financial, investment, trading, or other types of advice or recommendations supplied or endorsed by TradingView. Read more in the Terms of Use.
BTC
bc1q2eckdzh0q8vsd7swcc8et6ze7s99khhxyl7zwy
Weblink: patreon.com/withoutworries
Allow 3-6 months on ideas. Not investment advice. DYOR
bc1q2eckdzh0q8vsd7swcc8et6ze7s99khhxyl7zwy
Weblink: patreon.com/withoutworries
Allow 3-6 months on ideas. Not investment advice. DYOR
Disclaimer
The information and publications are not meant to be, and do not constitute, financial, investment, trading, or other types of advice or recommendations supplied or endorsed by TradingView. Read more in the Terms of Use.