📌🚀
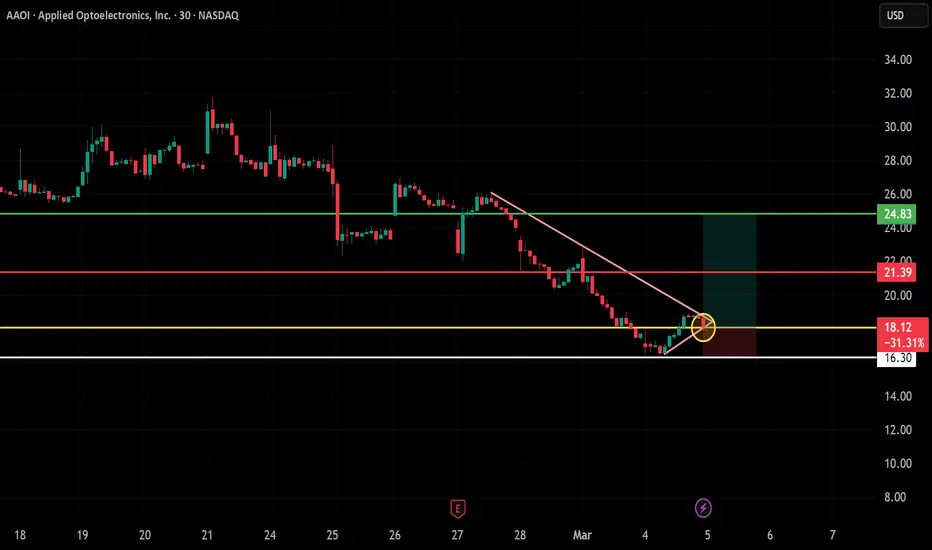
🔹 Asset: AAOI (Applied Optoelectronics, Inc.)
🔹 Timeframe: 30-Min Chart
🔹 Setup Type: Bullish Reversal Trade
📌 Trade Plan (Long Position)
✅ Entry Zone: Above $18.12 (Breakout Confirmation)
✅ Stop-Loss (SL): Below $16.30 (Invalidation Level)
🎯 Take Profit Targets:
📌 TP1: $21.39 (First Resistance Level)
📌 TP2: $24.83 (Extended Bullish Move)
📊 Risk-Reward Ratio Calculation
📉 Risk (SL Distance): $18.12 - $16.30 = $1.82 risk per share
📈 Reward to TP1: $21.39 - $18.12 = $3.27 (1:1.8 R/R)
📈 Reward to TP2: $24.83 - $18.12 = $6.71 (1:3.7 R/R)
🔍 Technical Analysis & Strategy
📌 Falling Wedge Breakout: Price has broken out of a falling wedge, a strong bullish reversal pattern.
📌 Support Rejection: The price tested $16.30 support and showed buying pressure.
📌 Volume Confirmation Needed: Ensure high buying volume when price holds above $18.12 to confirm bullish momentum.
📌 Momentum Shift Expected: If price remains above $18.12, it could push toward $21.39, and further to $24.83.
📊 Key Support & Resistance Levels
🟢 $16.30 – Stop-Loss / Support Level
🟡 $18.12 – Breakout Level / Long Entry
🔴 $21.39 – First Resistance / TP1
🔴 $24.83 – Final Target / TP2
📉 Trade Execution & Risk Management
📊 Volume Confirmation: Ensure high buying volume above $18.12 before entering.
📉 Trailing Stop Strategy: Move SL to entry ($18.12) after TP1 ($21.39) is hit.
💰 Partial Profit Booking Strategy:
✔ Take 50% profits at $21.39, let the rest run toward $24.83.
✔ Adjust Stop-Loss to Break-even ($18.12) after TP1 is reached.
⚠️ Fake Breakout Risk
❌ If the price fails to hold above $18.12 and drops back, exit early to avoid losses.
❌ Wait for a strong bullish candle close above $18.12 before entering aggressively.
🚀 Final Thoughts
✔ Bullish Setup – Bouncing from $16.30 support suggests a potential reversal.
✔ Momentum Shift Possible – Watch for volume confirmation.
✔ Favorable Risk-Reward Ratio – 1:1.8 to TP1, 1:3.7 to TP2.
💡 Stick to the plan, manage risk, and trade smart! 🚀📈
🔗 Hashtags for Reach & Engagement:
#StockMarket 📉 #TradingNews 📰 #StockAnalysis 📊 #MarketUpdate 🔥 #Investing 💰 #Trading 📈 #Finance 💵 #ProfittoPath 🚀 #SwingTrading 🔄 #DayTrading ⚡ #StockTrader 💸 #TechnicalAnalysis 📉 #EconomicNews 🏛️ #FinancialFreedom 💡 #MarketTrends 📊 #StockAlerts 🔔 #TradeSmart 🤓 #Bullish 🐂 #RiskManagement ⚠️ #TradingCommunity 🤝
Disclaimer
The information and publications are not meant to be, and do not constitute, financial, investment, trading, or other types of advice or recommendations supplied or endorsed by TradingView. Read more in the Terms of Use.
Disclaimer
The information and publications are not meant to be, and do not constitute, financial, investment, trading, or other types of advice or recommendations supplied or endorsed by TradingView. Read more in the Terms of Use.