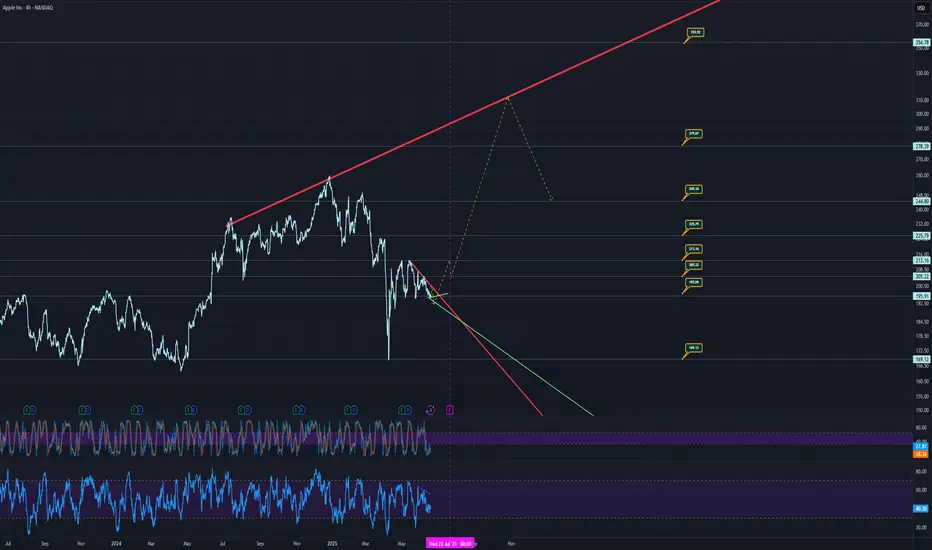
The chart for Apple (NASDAQ: AAPL) shows the following key elements:
Rejection Trends: Marked in red, indicating levels where the price has faced resistance and reversed.
Support Levels: Marked in green, with horizontal support indicated by dotted lines, showing price levels where the stock has historically found buying interest.
Price Targets: Marked with specific values, suggesting potential future price levels based on the analysis.
Guideline: Represented by a dashed line, likely indicating a trend or channel guideline.
RSI and Trends: Displayed at the bottom, with the Relative Strength Index (RSI) and additional trend indicators in colorful lines.
Earnings: Marked with purple dashed lines, highlighting significant earnings dates or periods.
The chart covers a timeframe from mid-2023 to June 20, 2025, with the latest data point at 12:07 AM EDT on June 20, 2025.
Watch out, because there is a price target to 169. Meaning, we need to be careful.
There is also a price target to 280+ which has support of indicators.
Heading into earnings we might see the 215 mark which could see a slight drop to around 205, and then could see a climb over months to 280. Even 300+
Watch the trends, and price targets, if at trend, look to sell or buy depending on if support or resistance.
Cashapp: $nicktussing
Venmo: @nicktussing
Donations appreciated, NOT AT ALL REQUIRED OR EXPECTED.
Venmo: @nicktussing
Donations appreciated, NOT AT ALL REQUIRED OR EXPECTED.
Disclaimer
The information and publications are not meant to be, and do not constitute, financial, investment, trading, or other types of advice or recommendations supplied or endorsed by TradingView. Read more in the Terms of Use.