🧠 Smart Money Technical Analysis (1H Chart)
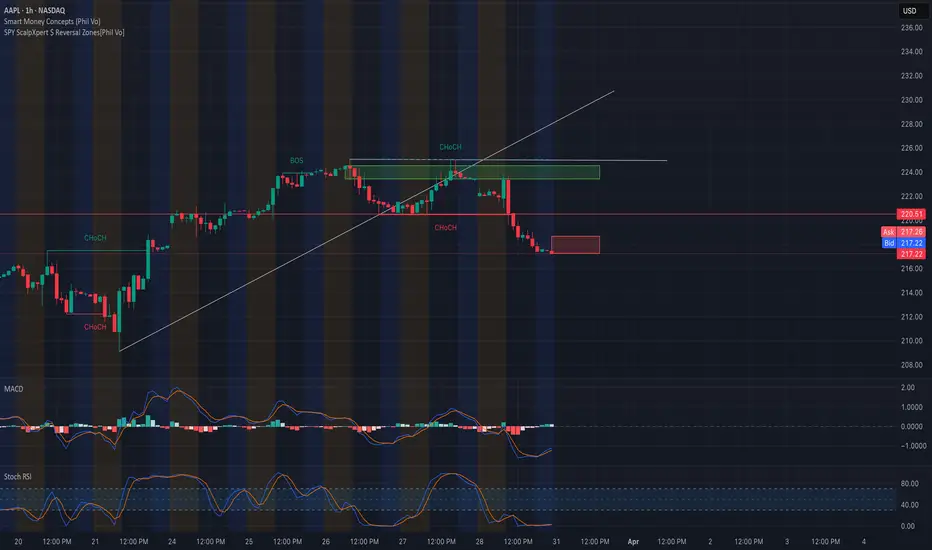
* Market Structure: AAPL recently broke its bullish trendline and confirmed CHoCH (Change of Character) twice, followed by a clear Break of Structure (BOS) on the 1H timeframe. Price is now in a minor bearish trend.
* Rejection Zone: Strong sell pressure came from the $225–$228 supply zone, which aligned with both CHoCH and BOS, acting as confirmation of distribution by smart money.
* Current Price: ~$217.26 Price is hovering just above the red support zone (~$215) — a key level. A breakdown here would suggest acceleration of the bearish move.
* Indicators:
* MACD: Bearish crossover and momentum pushing down, though histogram is flattening — potential loss of downside momentum.
* Stochastic RSI: Oversold, indicating a possible bounce, but not yet confirmed.
📊 Options GEX & Flow Analysis

* GEX Map:
* Gamma Resistance sits at $225–$228, aligned with Smart Money’s CHoCH zone.
* GEX Walls:
* 2nd CALL Wall: $227.5 (34.53%)
* Highest NETGEX: $222.5
* 3rd CALL Wall: $230 (39.67%)
* PUT Support Zones:
* Strongest PUT Wall: $215 (-81.59%)
* Next downside wall: $210 (-60.42%)
* Extreme Support: $200 (-21.37%)
* Options Oscillator:
* IVR: 54.3 — moderately elevated.
* IVx Avg: 38.4
* PUT$ Flow: 20% dominance, leaning bearish.
* Sentiment Lights: 🔴🔴🟢 — Bearish Bias with Caution
⚔️ Scenarios & Trading Ideas
🟢 Bullish Scenario (Low Probability)
* If $215 holds as support and MACD reverses:
* Entry: Above $218.50
* Target 1: $222.5 (Gamma magnet)
* Target 2: $225–$228 (Supply + GEX cluster)
* Stop: Below $214.50
🔴 Bearish Scenario (Preferred Bias)
* Break and close below $215 support opens downside:
* Entry: Under $214.50
* Target 1: $210 (Put Wall)
* Target 2: $205 / $200 (Deep put walls)
* Stop: Above $218
🔍 Summary
AAPL is currently sitting at a pivotal level ($215), with bearish momentum taking hold. If it loses this level, expect a slide toward $210 and possibly deeper. GEX positioning supports downside flow, while SMC shows supply zones were defended. Watch closely for any bounce or breakdown confirmation — this is a trader’s edge zone.
Disclaimer: This analysis is for educational purposes only and does not constitute financial advice. Always conduct your own research and manage risk appropriately.
* Market Structure: AAPL recently broke its bullish trendline and confirmed CHoCH (Change of Character) twice, followed by a clear Break of Structure (BOS) on the 1H timeframe. Price is now in a minor bearish trend.
* Rejection Zone: Strong sell pressure came from the $225–$228 supply zone, which aligned with both CHoCH and BOS, acting as confirmation of distribution by smart money.
* Current Price: ~$217.26 Price is hovering just above the red support zone (~$215) — a key level. A breakdown here would suggest acceleration of the bearish move.
* Indicators:
* MACD: Bearish crossover and momentum pushing down, though histogram is flattening — potential loss of downside momentum.
* Stochastic RSI: Oversold, indicating a possible bounce, but not yet confirmed.
📊 Options GEX & Flow Analysis
* GEX Map:
* Gamma Resistance sits at $225–$228, aligned with Smart Money’s CHoCH zone.
* GEX Walls:
* 2nd CALL Wall: $227.5 (34.53%)
* Highest NETGEX: $222.5
* 3rd CALL Wall: $230 (39.67%)
* PUT Support Zones:
* Strongest PUT Wall: $215 (-81.59%)
* Next downside wall: $210 (-60.42%)
* Extreme Support: $200 (-21.37%)
* Options Oscillator:
* IVR: 54.3 — moderately elevated.
* IVx Avg: 38.4
* PUT$ Flow: 20% dominance, leaning bearish.
* Sentiment Lights: 🔴🔴🟢 — Bearish Bias with Caution
⚔️ Scenarios & Trading Ideas
🟢 Bullish Scenario (Low Probability)
* If $215 holds as support and MACD reverses:
* Entry: Above $218.50
* Target 1: $222.5 (Gamma magnet)
* Target 2: $225–$228 (Supply + GEX cluster)
* Stop: Below $214.50
🔴 Bearish Scenario (Preferred Bias)
* Break and close below $215 support opens downside:
* Entry: Under $214.50
* Target 1: $210 (Put Wall)
* Target 2: $205 / $200 (Deep put walls)
* Stop: Above $218
🔍 Summary
AAPL is currently sitting at a pivotal level ($215), with bearish momentum taking hold. If it loses this level, expect a slide toward $210 and possibly deeper. GEX positioning supports downside flow, while SMC shows supply zones were defended. Watch closely for any bounce or breakdown confirmation — this is a trader’s edge zone.
Disclaimer: This analysis is for educational purposes only and does not constitute financial advice. Always conduct your own research and manage risk appropriately.
Disclaimer
The information and publications are not meant to be, and do not constitute, financial, investment, trading, or other types of advice or recommendations supplied or endorsed by TradingView. Read more in the Terms of Use.
Disclaimer
The information and publications are not meant to be, and do not constitute, financial, investment, trading, or other types of advice or recommendations supplied or endorsed by TradingView. Read more in the Terms of Use.