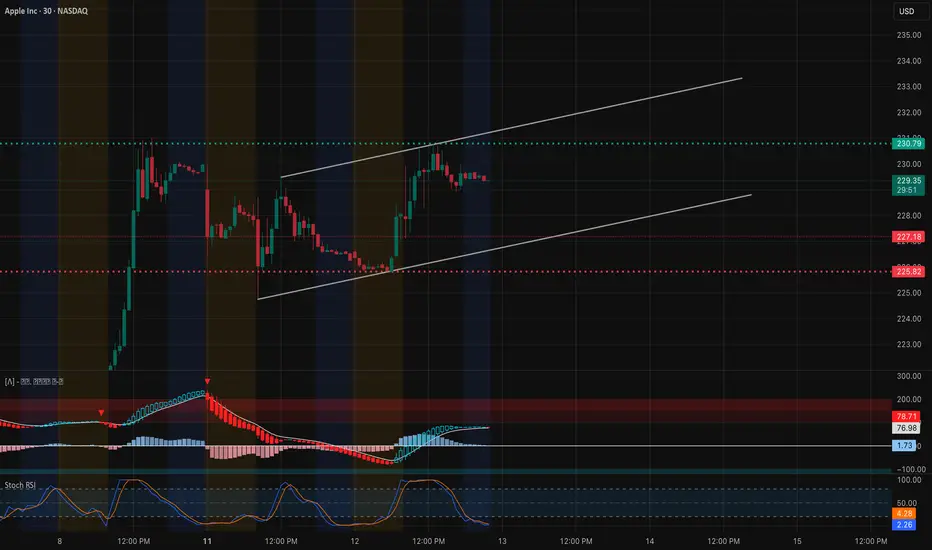
30-Minute Price Action
AAPL is trading inside a rising channel, showing steady higher lows but stalling under $230.79.
* Resistance: $230.79 – tested multiple times, acting as a lid.
* Support: $227.18 – intraday floor; $225.82 – lower channel & previous demand.
* Indicators:
* MACD momentum is still positive but flattening, signaling reduced buying pressure.
* Stoch RSI is near oversold levels, giving room for a potential bounce if support holds.
1-Hour GEX Insights

* Highest Positive NET GEX / Gamma Wall: $230.79 – aligns perfectly with 30m resistance, explaining repeated stalls.
* Next Call Walls Above: $233.5 & $237.5 – strong upside targets if $230.79 is broken.
* Put Support: $217.5 (1st defense), $210 (major downside GEX floor).
* IVR: 16.9 – relatively low implied volatility, making long options cheaper than usual.
TA + GEX Combined Read
The $230.79 level is critical — it’s both technical resistance on the 30m and the largest gamma wall on the 1h GEX chart.
* If AAPL breaks and holds above $230.79, gamma positioning could fuel a quick push to $233.5 and possibly $237.5.
* If rejected again, expect a pullback toward $227.18 and possibly $225.82, where technical support and the lower channel converge.
Trading Scenarios for August 13
* Bullish Breakout: Long calls or call spreads above $230.79 targeting $233.5 / $237.5.
* Bearish Rejection: Short-term puts or put spreads if $230.79 rejects and $227.18 breaks, targeting $225.82.
* Range Play: If stuck between $227–$231, credit spreads could work given low IVR.
Reasoning The 30m chart shows the rising channel structure, and the 1h GEX confirms why $230.79 is the decision point. A breakout can trigger hedging pressure to the upside; failure there points to a controlled drift back to lower channel support.
Disclaimer: This analysis is for educational purposes only and does not constitute financial advice. Always do your own research and manage risk appropriately before trading.
AAPL is trading inside a rising channel, showing steady higher lows but stalling under $230.79.
* Resistance: $230.79 – tested multiple times, acting as a lid.
* Support: $227.18 – intraday floor; $225.82 – lower channel & previous demand.
* Indicators:
* MACD momentum is still positive but flattening, signaling reduced buying pressure.
* Stoch RSI is near oversold levels, giving room for a potential bounce if support holds.
1-Hour GEX Insights
* Highest Positive NET GEX / Gamma Wall: $230.79 – aligns perfectly with 30m resistance, explaining repeated stalls.
* Next Call Walls Above: $233.5 & $237.5 – strong upside targets if $230.79 is broken.
* Put Support: $217.5 (1st defense), $210 (major downside GEX floor).
* IVR: 16.9 – relatively low implied volatility, making long options cheaper than usual.
TA + GEX Combined Read
The $230.79 level is critical — it’s both technical resistance on the 30m and the largest gamma wall on the 1h GEX chart.
* If AAPL breaks and holds above $230.79, gamma positioning could fuel a quick push to $233.5 and possibly $237.5.
* If rejected again, expect a pullback toward $227.18 and possibly $225.82, where technical support and the lower channel converge.
Trading Scenarios for August 13
* Bullish Breakout: Long calls or call spreads above $230.79 targeting $233.5 / $237.5.
* Bearish Rejection: Short-term puts or put spreads if $230.79 rejects and $227.18 breaks, targeting $225.82.
* Range Play: If stuck between $227–$231, credit spreads could work given low IVR.
Reasoning The 30m chart shows the rising channel structure, and the 1h GEX confirms why $230.79 is the decision point. A breakout can trigger hedging pressure to the upside; failure there points to a controlled drift back to lower channel support.
Disclaimer: This analysis is for educational purposes only and does not constitute financial advice. Always do your own research and manage risk appropriately before trading.
Disclaimer
The information and publications are not meant to be, and do not constitute, financial, investment, trading, or other types of advice or recommendations supplied or endorsed by TradingView. Read more in the Terms of Use.
Disclaimer
The information and publications are not meant to be, and do not constitute, financial, investment, trading, or other types of advice or recommendations supplied or endorsed by TradingView. Read more in the Terms of Use.