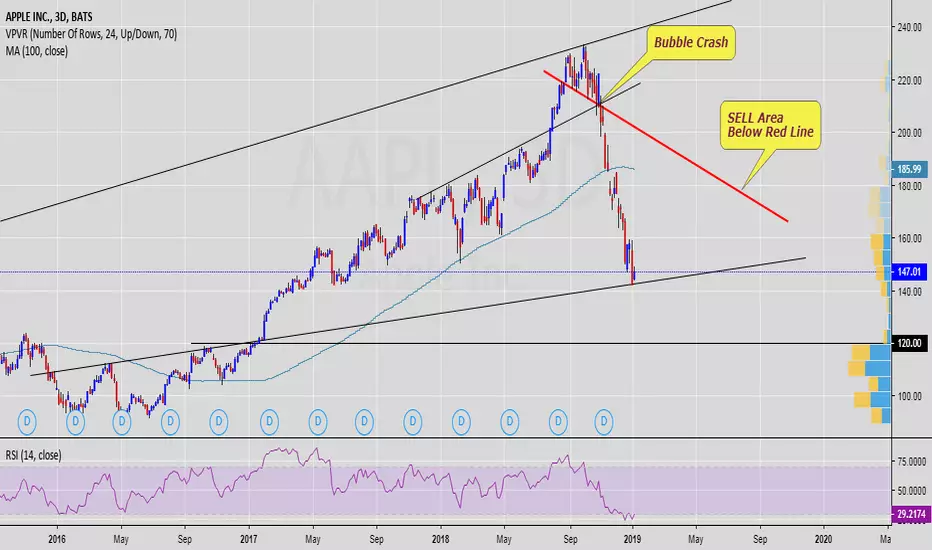
Let's take a look on Aaple stocks 3D (3-days) chart.
Technically we've got in Q4 '18 the worst reversal scenario ever, - as the price turned from o/bought into o/sold area around $210 just in a single movement. Yes, that is still the Bubble above $120.
My focus is the price should be higher bearish neckline , for any further purchases.
Technically we've got in Q4 '18 the worst reversal scenario ever, - as the price turned from o/bought into o/sold area around $210 just in a single movement. Yes, that is still the Bubble above $120.
My focus is the price should be higher bearish neckline , for any further purchases.
Note
BUMP is at the endDisclaimer
The information and publications are not meant to be, and do not constitute, financial, investment, trading, or other types of advice or recommendations supplied or endorsed by TradingView. Read more in the Terms of Use.
Disclaimer
The information and publications are not meant to be, and do not constitute, financial, investment, trading, or other types of advice or recommendations supplied or endorsed by TradingView. Read more in the Terms of Use.