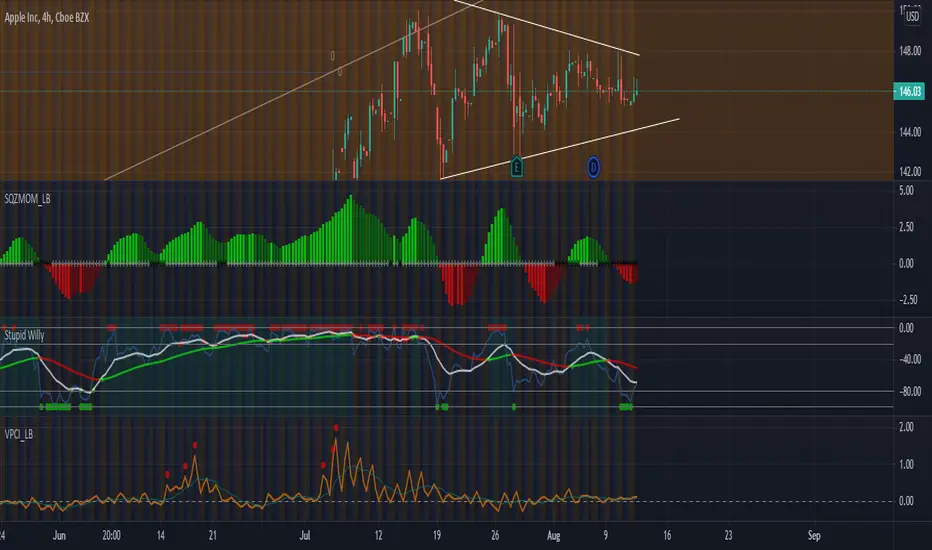
AAPL has shown multiple signs of being bullish. AAPL's chart can be seen to display a bullish chart pattern called the bullish pennant. Not only do we have a bullish chart pattern but we have seen a reduction in selling momentum on the daily and 4h time frames. Watch for a breakout. Although we are seeing multiple signs of bullishness, it is best to wait for greater confirmation.
Bullish Signals
-Squeeze indicator
-Oversold Willy
-Bullish Chart Pattern(pennant)
Bullish Signals
-Squeeze indicator
-Oversold Willy
-Bullish Chart Pattern(pennant)
Disclaimer
The information and publications are not meant to be, and do not constitute, financial, investment, trading, or other types of advice or recommendations supplied or endorsed by TradingView. Read more in the Terms of Use.
Disclaimer
The information and publications are not meant to be, and do not constitute, financial, investment, trading, or other types of advice or recommendations supplied or endorsed by TradingView. Read more in the Terms of Use.