Apple's stock (AAPL) is currently trading at $201.15, reflecting a modest uptick of 0.47% today. Despite this slight gain, the stock has experienced a 22% decline year-to-date, underperforming its tech peers.
Technical Overview
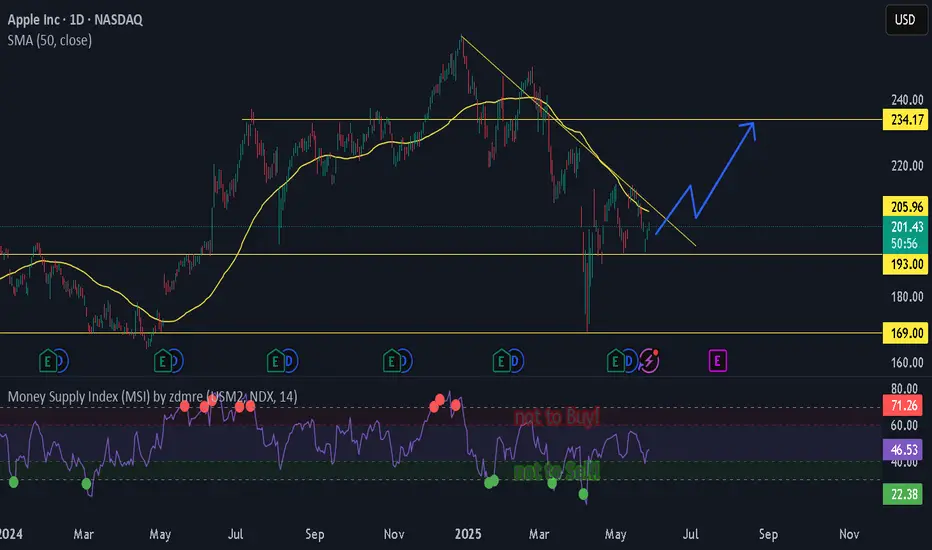
The stock is navigating a descending broadening pattern, indicating ongoing bearish momentum. Notably, a "death cross" formation occurred in April, where the 50-day moving average crossed below the 200-day moving average, signalling potential further declines.
Support Levels: $193 and $169
Resistance Levels: $215 and $237
A break above the $215 resistance could pave the way for a rally towards $237. Conversely, a drop below the $193 support might lead to a decline towards $169.
Macroeconomic Factors
Recent political developments have introduced volatility. President Trump's proposal of a 25% tariff on iPhones not manufactured in the U.S. has raised concerns. In response, Apple is reportedly shifting a significant portion of its production to India to mitigate potential tariff impacts.
Fundamental Metrics
Market Capitalization: Approximately $3.28 trillion.
Price-to-Earnings (P/E) Ratio: 33.72.
Earnings Per Share (EPS): $6.42.
While Apple's P/E ratio is above its 10-year average, indicating a premium valuation, the company's robust earnings and strategic initiatives continue to attract investor interest.
Conclusion
Apple's stock is at a critical juncture, influenced by technical patterns and macroeconomic factors. Investors should monitor the $215 resistance and $193 support levels closely. A break in either direction could signal the stock's next significant move.
Technical Overview
The stock is navigating a descending broadening pattern, indicating ongoing bearish momentum. Notably, a "death cross" formation occurred in April, where the 50-day moving average crossed below the 200-day moving average, signalling potential further declines.
Support Levels: $193 and $169
Resistance Levels: $215 and $237
A break above the $215 resistance could pave the way for a rally towards $237. Conversely, a drop below the $193 support might lead to a decline towards $169.
Macroeconomic Factors
Recent political developments have introduced volatility. President Trump's proposal of a 25% tariff on iPhones not manufactured in the U.S. has raised concerns. In response, Apple is reportedly shifting a significant portion of its production to India to mitigate potential tariff impacts.
Fundamental Metrics
Market Capitalization: Approximately $3.28 trillion.
Price-to-Earnings (P/E) Ratio: 33.72.
Earnings Per Share (EPS): $6.42.
While Apple's P/E ratio is above its 10-year average, indicating a premium valuation, the company's robust earnings and strategic initiatives continue to attract investor interest.
Conclusion
Apple's stock is at a critical juncture, influenced by technical patterns and macroeconomic factors. Investors should monitor the $215 resistance and $193 support levels closely. A break in either direction could signal the stock's next significant move.
Trade active
If it breaks the downtrend, the rise will begin.Disclaimer
The information and publications are not meant to be, and do not constitute, financial, investment, trading, or other types of advice or recommendations supplied or endorsed by TradingView. Read more in the Terms of Use.
Disclaimer
The information and publications are not meant to be, and do not constitute, financial, investment, trading, or other types of advice or recommendations supplied or endorsed by TradingView. Read more in the Terms of Use.