I have been tracking this pattern that  AAPL started forming in April for some time now.
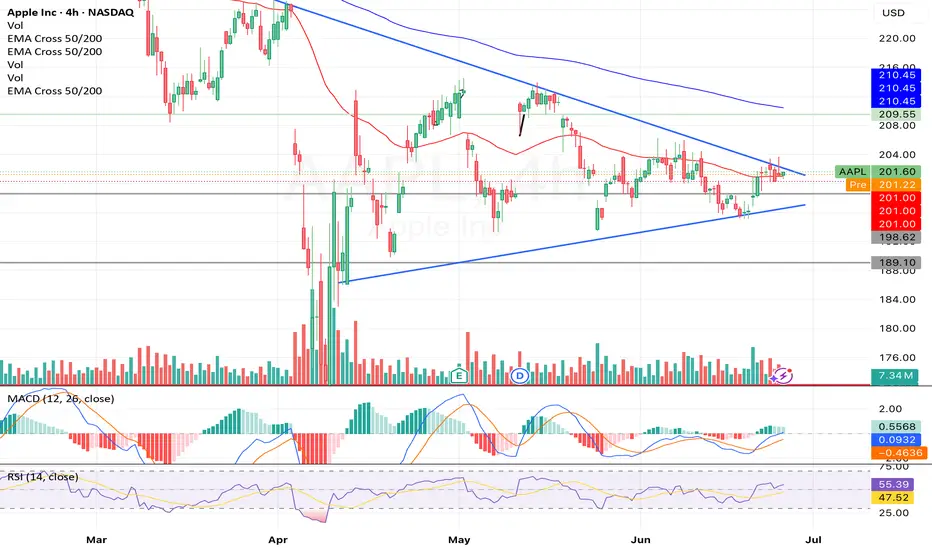
This is a classic symmetrical triangle formation with significant consolidation in the last trading sessions. This patterns typically lead to a breakout in either direction, and since price is near the apex, a breakout is imminent within 1–3 trading sessions.
Typically, this is bearish when price is below both 50 and 200 EMA. However, the MACD and RSI indicators both support an imminent bullish move forming with an increase in volume.
With headwinds from antitrust issues in the EU and U.S. I wont be surprised if this breaks out significantly upwards with some positive news acting as the catalyst.
The conservative trader will place a straddle aiming for $210.45 (EMA resistance) upside and but $192–194 (prior demand zone) downside.
The riskier and probably more rewarding bet would be to place a call aiming for the $218-$224 resistance zone after this breaks $202.30
This is a classic symmetrical triangle formation with significant consolidation in the last trading sessions. This patterns typically lead to a breakout in either direction, and since price is near the apex, a breakout is imminent within 1–3 trading sessions.
- Current Price: $201.60 (slightly above the key $201 support/resistance zone).
- Key Support: $198.62 (recent higher low).
- Major Support: $189.10 (multi-month low).
- Resistance Zone: $202.30 (pre-market), then $210.45 (EMA 200/50 convergence).
- EMA 50/200 Cross: Both EMAs are converging at ~$210.45, which has become a significant resistance ceiling.
Typically, this is bearish when price is below both 50 and 200 EMA. However, the MACD and RSI indicators both support an imminent bullish move forming with an increase in volume.
With headwinds from antitrust issues in the EU and U.S. I wont be surprised if this breaks out significantly upwards with some positive news acting as the catalyst.
The conservative trader will place a straddle aiming for $210.45 (EMA resistance) upside and but $192–194 (prior demand zone) downside.
The riskier and probably more rewarding bet would be to place a call aiming for the $218-$224 resistance zone after this breaks $202.30
Trade active
💼 PositionType: AAPL 225 Call
Expiry: July 25, 2025
Average Cost Basis: $0.33
Date Purchased: June 27, 2025
Last Price: $0.32
Total % Gain/Loss: -3.03%
Trade closed: target reached
💼 PositionType: AAPL 225 Call
Expiry: July 25, 2025
Average Cost Basis: $0.33
Date Purchased: June 27, 2025
Last Price: $1.11
Total % Gain/Loss: +346%%
Disclaimer
The information and publications are not meant to be, and do not constitute, financial, investment, trading, or other types of advice or recommendations supplied or endorsed by TradingView. Read more in the Terms of Use.
Disclaimer
The information and publications are not meant to be, and do not constitute, financial, investment, trading, or other types of advice or recommendations supplied or endorsed by TradingView. Read more in the Terms of Use.