TDI (Traders Dynamics Index) is a powerful tool that determine the entry signal This indicator consists of 3 important indicators a below
How to use the above indicator is as below
[1] When the Green cross the Red positively, this is a green signal to buy
[2] When the Yellow cross the Red positively, this is a green signal to buy
[3] When the Yellow moves above the Red line, the market in up trend. If the Yellow moves below the Red line, the market in down trend
[4] Crossing the Yellow line of the lower RSI band from bottom to top mean time to buy, while Crossing the Yellow line of the upper RSI band from top to down mean time to sell
[5] Crossing the Yellow line the average RSI line (50) means time to buy
[6] When the Green line cross the upper BB means the trend is strongly going up. If the Green line cross the lower BB line means the trend is strongly going down
[7] Easily can determine the RSI Divergence (opposite top or bottoms) with the stock. If opposite bottoms, time to buy and if opposite top, time to sell
[8] Best buy signal is when the Green line cross the Red line positively after the existing of RSI Divergence at the essential level
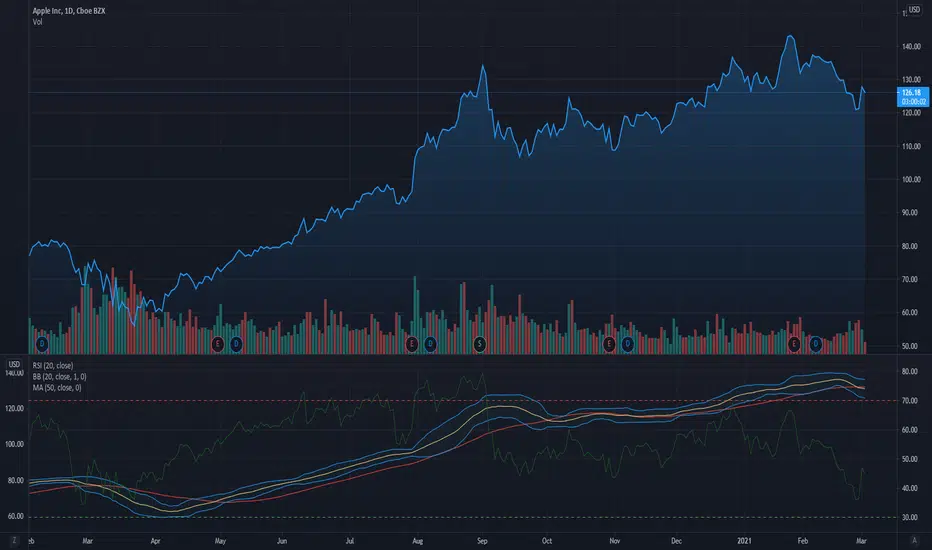
- [1] RSI (30, 70) Period (20) --> Green
[2] MA (50) --> Red
[3] Bollinger Bands --> Yellow with Blue band lines
How to use the above indicator is as below
[1] When the Green cross the Red positively, this is a green signal to buy
[2] When the Yellow cross the Red positively, this is a green signal to buy
[3] When the Yellow moves above the Red line, the market in up trend. If the Yellow moves below the Red line, the market in down trend
[4] Crossing the Yellow line of the lower RSI band from bottom to top mean time to buy, while Crossing the Yellow line of the upper RSI band from top to down mean time to sell
[5] Crossing the Yellow line the average RSI line (50) means time to buy
[6] When the Green line cross the upper BB means the trend is strongly going up. If the Green line cross the lower BB line means the trend is strongly going down
[7] Easily can determine the RSI Divergence (opposite top or bottoms) with the stock. If opposite bottoms, time to buy and if opposite top, time to sell
[8] Best buy signal is when the Green line cross the Red line positively after the existing of RSI Divergence at the essential level
Disclaimer
The information and publications are not meant to be, and do not constitute, financial, investment, trading, or other types of advice or recommendations supplied or endorsed by TradingView. Read more in the Terms of Use.
Disclaimer
The information and publications are not meant to be, and do not constitute, financial, investment, trading, or other types of advice or recommendations supplied or endorsed by TradingView. Read more in the Terms of Use.