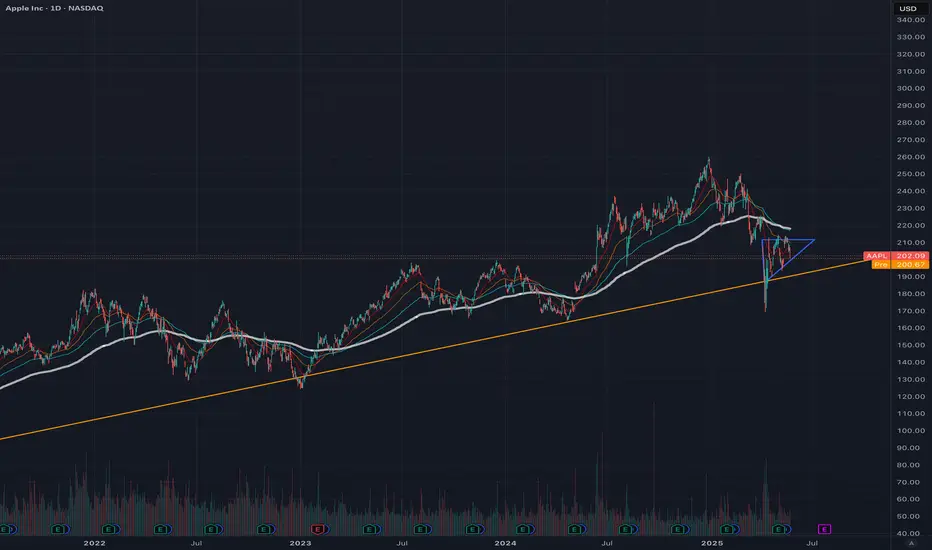
An ascending triangle is forming on the daily chart, resistance at ~211 USD, indicating that selling momentum is diminishing. Although there may be some further downside, recent economic pressures are leading to a healthy correction towards a long-term support trend that dates back to 2019. With some positive economic tailwinds, Apple could potentially offer good returns from this buying point.
Trade closed: stop reached
Pattern broken by tariff news.Note
Pattern could still be valid but with adjusted lower limits. Disclaimer
The information and publications are not meant to be, and do not constitute, financial, investment, trading, or other types of advice or recommendations supplied or endorsed by TradingView. Read more in the Terms of Use.
Disclaimer
The information and publications are not meant to be, and do not constitute, financial, investment, trading, or other types of advice or recommendations supplied or endorsed by TradingView. Read more in the Terms of Use.