Hello, traders.
If you "Follow", you can always get new information quickly.
Have a nice day today.
-------------------------------------
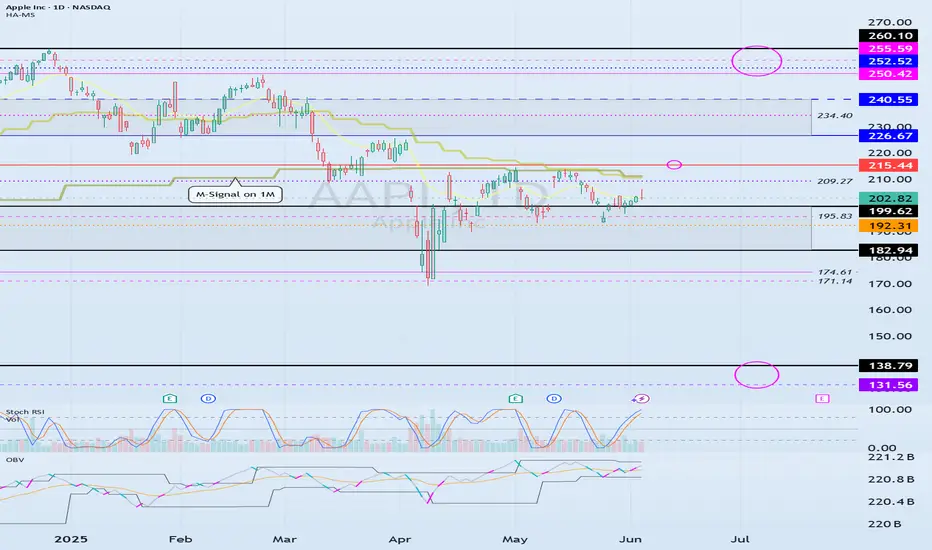
(AAPL 1D chart)
In order to continue the uptrend in the medium to long term, the price needs to stay above the M-Signal indicator on the 1M chart.
The important support and resistance zones at the current price position are the 182.94-199.62 zone and the 226.67-240.55 zone.
In that sense, the key is whether it can support near the 182.94-199.62 zone and rise above 209.27 to maintain the price.
The 226.67-240.55 zone is expected to act as resistance, but if it breaks through upward, it is expected to renew the ATH.
The important support zone is the 131.59-138.79 zone. If it falls to this area and shows support as the trading volume increases, you should focus on finding a buying point.
-
The basic trading strategy is to buy on the HA-Low indicator and sell on the HA-High indicator.
This trading strategy is a trading method within the box range.
If it falls below the HA-Low indicator or rises above the HA-High indicator, you should create a trading strategy using the trend trading method.
Therefore, the basic trading method should be a split trading method.
The 215.44 point is the OBV Low indicator point on the 12M chart, and from a long-term perspective, it can be interpreted that an uptrend can begin only when it rises above 215.44.
Therefore, you can see that the 209.27-215.44 section is an important section for turning into an uptrend.
-
Thank you for reading to the end.
I hope you have a successful trade.
--------------------------------------------------
Other content (coins, stocks, etc.) is frequently posted on X.
X에 다른 내용(코인, 주식 등)이 자주 게시.
◆ t.me/readCryptoChannel
[HA-MS Indicator]
bit.ly/3YxHgvN
[OBV Indicator]
bit.ly/4dcyny3
X에 다른 내용(코인, 주식 등)이 자주 게시.
◆ t.me/readCryptoChannel
[HA-MS Indicator]
bit.ly/3YxHgvN
[OBV Indicator]
bit.ly/4dcyny3
Disclaimer
The information and publications are not meant to be, and do not constitute, financial, investment, trading, or other types of advice or recommendations supplied or endorsed by TradingView. Read more in the Terms of Use.