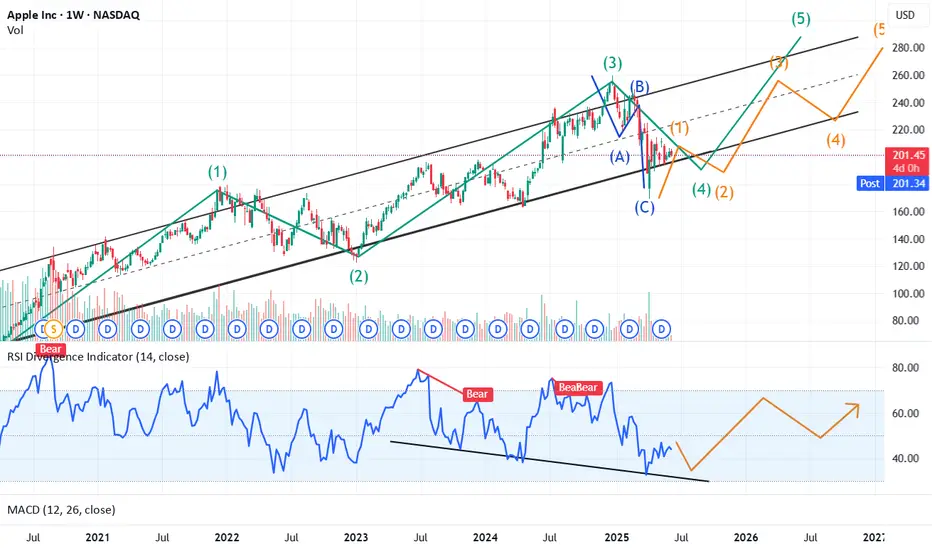
Apple’s weekly chart is showing a textbook Elliott Wave structure within a well-defined ascending channel. After completing a corrective (A)-(B)-(C) pattern for Wave 4, price action is now setting up for the next impulsive move.
Key Technical Highlights:
Elliott Wave Count:
The chart shows that Waves (1), (2), (3), and (4) are complete. The recent correction held at the lower channel boundary, suggesting Wave 4 is likely done and Wave 5 is about to begin.
Channel Support:
Price is respecting the long-term ascending channel. A retest of the lower channel (around the $180s) is possible, which would act as a strong support and an ideal launchpad for Wave 5.
RSI Divergence:
The RSI has formed multiple bearish divergences at previous peaks, accurately signaling corrections. Now, a bullish divergence is developing—RSI is making higher lows while price action makes lower lows—indicating waning bearish momentum and a potential reversal.
MACD & Volume:
MACD is stabilizing and could cross bullish near the channel support. Volume spikes at key turning points reinforce the significance of these levels.
Trade Plan & Outlook:
Watch for a retest of the $180s zone, where the lower channel and bullish RSI divergence converge.
If price holds this support and RSI confirms, it could mark the start of Wave 5, targeting the upper channel (potentially $280+).
Risk management: A sustained close below the channel would invalidate this bullish setup.
Summary:
Apple is at a critical juncture: a successful retest of the $180s with confirming RSI divergence could launch the 5th Elliott Wave, targeting new highs. Keep an eye on price action and momentum indicators for confirmation.
Disclaimer
The information and publications are not meant to be, and do not constitute, financial, investment, trading, or other types of advice or recommendations supplied or endorsed by TradingView. Read more in the Terms of Use.
Disclaimer
The information and publications are not meant to be, and do not constitute, financial, investment, trading, or other types of advice or recommendations supplied or endorsed by TradingView. Read more in the Terms of Use.