AAPL has already been affected by a Bearish Head & Shoulders reversal pattern earlier this year (see related).
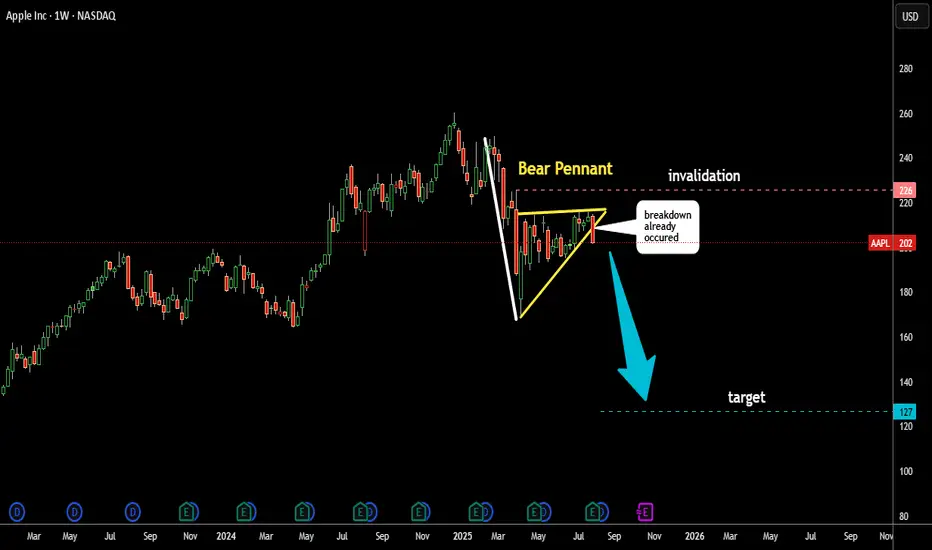
Now, another bearish pattern has formed — a Pennant (highlighted in yellow).
The price has broken below the Pennant’s support, triggering a potential bearish move.
The target is calculated by subtracting the length of the Pole (in white) from the support level of the pattern.
This target is marked with a blue dashed line at $127.
Is Apple melting down again?
I’d love to read your thoughts.
Related publications
Disclaimer
The information and publications are not meant to be, and do not constitute, financial, investment, trading, or other types of advice or recommendations supplied or endorsed by TradingView. Read more in the Terms of Use.
Related publications
Disclaimer
The information and publications are not meant to be, and do not constitute, financial, investment, trading, or other types of advice or recommendations supplied or endorsed by TradingView. Read more in the Terms of Use.