On the above 2-day chart price action has appreciated a massive 43,000% since August 2019. Can you believe that? Astonishingly 8/10 ideas on tradingview are long positions. The mind boggles.
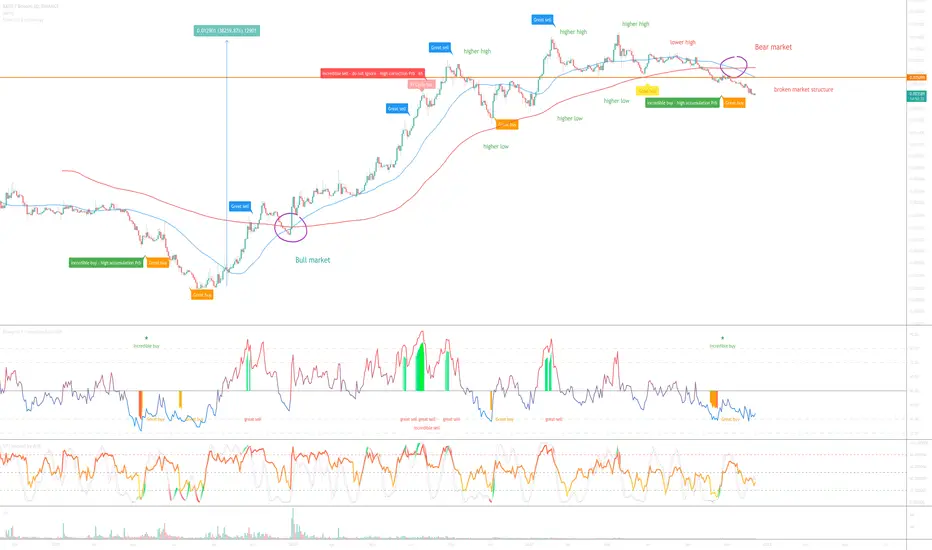
A number of reasons now exist to be bearish. Very bearish. PS: This is not a reflection on the entire alt-token market, idea on that coming soon! On the above 2-day chart:
1) A ‘incredible sell’ printed back in July followed by two ‘great sells’.
2) Pi cycle top indicator illuminated.
3) Trend reversal. A lower high was printed following a break of market structure.
4) Price action is in a bear market. The 2-day 50-day EMA (actually 100-days of data / blue line) crossed down the 200-day EMA + price action prints below the 200-day EMA.
Yes, a ‘incredible buy’ is currently printing. A test of 5 to 5.3k sats is expected. A short position from here is excellent, but no more longs - this is exit time.
Targets? I don’t know, 350 sats is the most obvious.
Good luck!
WW
Trade active
So far so good, lower lows / lower highs.Trade active
Price action rejects the 700-week MA. Not good. Will be months before it recovers, look left.Note
Be careful... if you're watching all those alt-tokens pop off and wondering when AAVE is going to follow then you might want to pay attention to this BTC pair on the 10-day chart.1) No buy signals.
2) Broken market structure.
3) Price action approaching critical resistance. Every time resistance is confirmed a strong sell off followed.
It's looking for ugly on this time frame.
Action? Do nothing until that resistance is broken and confirmed as support.
Trade active
New weekly death cross with *whole* candle body printed below the 21-week EMA. Long way down to support.Trade active
Just over a year since this idea was published, so far so good. A 10-day death has now printed. Whether it is a stock a crypto the price of fish cakes in Hong Kong, these crosses = ugly.10-day chart
Trade active
A 80% correction in price action is now highly probable... And suddenly. I don't know why.Note
Weekly death cross with bear flag breakout. 80% correction area is shown below.weekly chart
BTC
bc1q2eckdzh0q8vsd7swcc8et6ze7s99khhxyl7zwy
Weblink: patreon.com/withoutworries
Allow 3-6 months on ideas. Not investment advice. DYOR
bc1q2eckdzh0q8vsd7swcc8et6ze7s99khhxyl7zwy
Weblink: patreon.com/withoutworries
Allow 3-6 months on ideas. Not investment advice. DYOR
Disclaimer
The information and publications are not meant to be, and do not constitute, financial, investment, trading, or other types of advice or recommendations supplied or endorsed by TradingView. Read more in the Terms of Use.