*Swing trade opportunity*
Why that price? No other reason than the golden ratio retracement. Previous corrections in price action has shown a lot of respect for the 0.618.
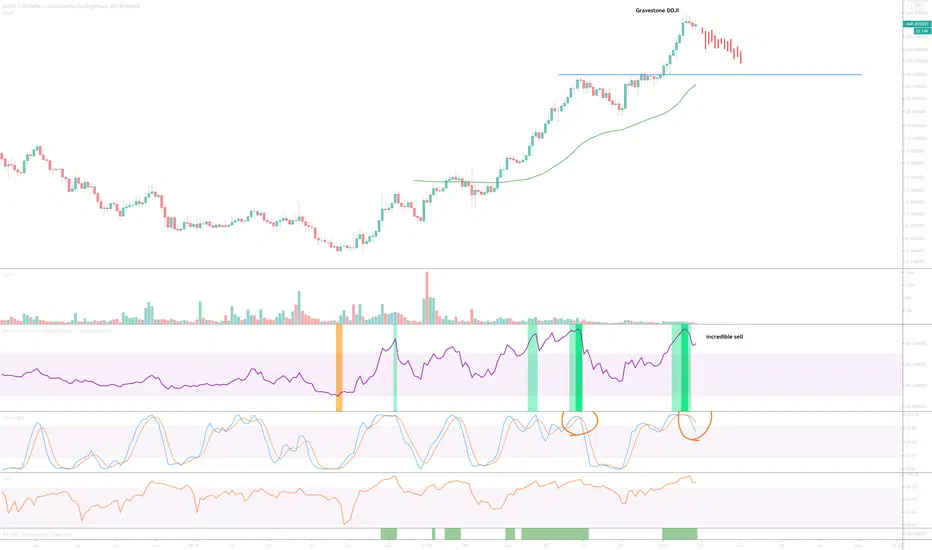
Why bearish? On the above 5—day chart Stochastic RSI is crossing down 80 (circled in orange) following an overbought condition (green column). Look left - don't ignore cross downs of the 80 on the 5-day chart.
Trade idea is void if price action breaks above $511
Why that price? No other reason than the golden ratio retracement. Previous corrections in price action has shown a lot of respect for the 0.618.
Why bearish? On the above 5—day chart Stochastic RSI is crossing down 80 (circled in orange) following an overbought condition (green column). Look left - don't ignore cross downs of the 80 on the 5-day chart.
Trade idea is void if price action breaks above $511
Trade active
Trade active
Target now updated to $266Facts of the chart can't be ignored.
Trade closed: stop reached
Trade active
Trade closed: target reached
At last. RSI moves under 50 on the 5-day chart below with no 'oversold' condition apparent. If $196 fails; $140 and then $90 are the next targets to look for.
BTC
bc1q2eckdzh0q8vsd7swcc8et6ze7s99khhxyl7zwy
Weblink: patreon.com/withoutworries
Allow 3-6 months on ideas. Not investment advice. DYOR
bc1q2eckdzh0q8vsd7swcc8et6ze7s99khhxyl7zwy
Weblink: patreon.com/withoutworries
Allow 3-6 months on ideas. Not investment advice. DYOR
Disclaimer
The information and publications are not meant to be, and do not constitute, financial, investment, trading, or other types of advice or recommendations supplied or endorsed by TradingView. Read more in the Terms of Use.