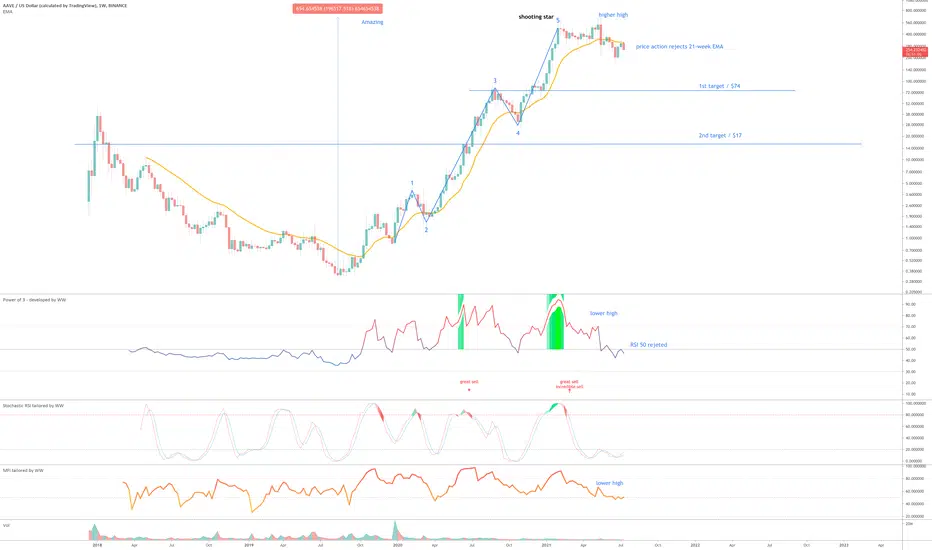
The probability of further upside following a massive 196,000%!! return since August 2019 and two overbought conditions has reached a limit. The risk / reward now belongs to the sellers.
Why bearish? On the above weekly there a number of significant developments:
1) Price action has recently broken the 21-week EMA (yellow line), came back up to test it as resistance and confirmed with a full bodied candle closing below.
2) Bearish divergence between price action and the oscillators. Higher highs in price action with lower highs in RSI and MFI.
3) RSI breaks through the 50 level, came up to test it and confirmed resistance. RSI now <50 = very bearish.
4) Astonishingly 87% of tradingview ideas are long counting the first 50 recently published. 90% of traders out there will lose money. Don’t be the 90.
5) A ‘spinning top’ candle recently printed on the monthly chart (below) but was unable to confirm trend reversal until the following month. The trend reversal is now confirmed. Additionally the Stochastic RSI has crossed down 80 (yellow circle), do not ignore this especially after such increase in price.
A short entry from $420 is amazing but consider the risk taken. That’s greed taking to you.
Trade is void with a weekly candle closing above $530.
Target? Two, 1st $74 followed by $17
WW
Note
This trade remains open for as long as the above conditions remain true:"Trade is void with a weekly candle closing above $530"
Note
In addition to the void price...If the month of August closes at $395, do get out. It will be a very strong bearish signal on the monthly.
Ask me to update the idea if that should play out.
Note
Unlike other alt-coins AAVE dropped 20% in a single trading session yesterday. Ouch. That was a warning.Tomorrow a new 10-day candle prints on the 10-day chart below. Two observations (those are not my opinions, just the facts of the chart);
1) RSI is testing resistance. Bulls need this to be broken. If resistance confirms, price action will drop hard. Watch this RSI like a hawk if you're long.
2) Oscillators showing bearish divergence. Remember this is a 10-day chart, this is a powerful time scale to study. There are now 9 (circled in purple) oscillators showing bearish divergence with price action. This is significant. What is it telling you? Strength is leaving.
Trade active
Have been watching the 2-day chart below closely. Confirmation appears to have occurred (circled in purple), bulls please pay attention:1) June 16th, 2019. That was the last time price action entered the Gaussian channel and tested the upper the upper side of the channel to confirm as resistance. A 70% correction followed.
Am not saying the same correction will occur again, but the evidence is very compelling.
Note
Remember what was said above:"If the month of August closes at $395, do get out. It will be a very strong bearish signal on the monthly."
Price action is below this level as of now. It simply must get above this level in the next 6-days. No ifs no buts, a failure to do so will open the door for a bear feeding frenzy.
Note
As mentioned in last post above "If the month of August closes at $395, do get out"Price action closed at $394 at the month end, price is now at $335.
To reverse further downside price action must hold $330 by the close of this week. Failure to do so will be very bearish.
Note
w.r.t to the last sentence above the chart below did not show. It is below. The 21-week EMA is broken at this moment (price action for many alt coins are showing support or well above this EMA).Like the August warning, this is a weekly warning. A weekly close below $330 will be devastating for price action. Don't let emotions make your decisions.
Trade active
"To reverse further downside price action must hold $330 by the close of this week."Failed.
Next level to watch is $280. Failure to hold that will mean new lows. There's a pattern forming here... ;)
Trade active
Support fails as does the above $280 level. Price action now enters the lower channel opening the door to $100Note
Should there be bulls still in denial after a 200000% rally it might be worth drawing your attention to the monthly chart, which closes the candle in 5 days. Watch it closely, if a bearish engulfing candle is confirmed price action will move down.Look where the next support is, $75. It will be a free fall - protect your profits!
Note
A new 10-day candle was printed today.If you remain bullish, pay attention to this chart if none else, it is important. Almost 3 years of price action history finds support or resistance around this trend line. It is strong.
Price action prints a candle breaking support. To remain bullish price action must reverse this trend to $400 within the next 10-days. If not, it is the ultimate bearish indication, look left!
Note
When the 10-day chart 21-week EMA crossed up the 21-day EMA (first purple circle) it was amazing for price action. The reverse just happened. Trade active
RSI @ 50 was broken some weeks back on the weekly chart (below). With this weekly close fast approaching something significant is occurring as RSI prints lower highs. What? Following the break of 50.... RSI has risen to test 50 as resistance. The resistance is confirmed, unless in the final hours of today it shoots upward and beyond.Look for support around $160.
Trade active
** death cross **763 days since a full weekly candle body was printed under the 50-week EMA. Conversely the 21-week EMA has just crossed down the 50-week EMA.
Trade active
An update of the 4-day chart posted above somewhere. Price action is making good progress towards the lower channel. Will be interesting to watch the interaction with the $160 - 170 area.Note
Monthly chart now shows the slow stochastic RSI crossing below 20 (red line in purple circle). Nothing good will happen for as long as the slow stochastic is under this level.Look for support on $75. When it breaks a run to target should be expected.
Trade active
2-day chart (below) / 200-day EMA was just confirmed as resistance. Look left. Down 40% since this idea was opened. Last time this EMA was confirmed resistance price action fell another 50%.Trade active
A perfect test of the 2-day / 50-day EMA as resistance following the 2-day death cross. Be patient, should hit target in time.Note
For the first time since may 2018 price action on the 10-day chart (below) is confirming resistance against the 50-week moving average (blue line). Price action must break up and above to avoid a weekly death cross by the 21-week EMA (yellow line).When the 21-week EMA crossed up the 50-week MA back in November 2019, it was wildly bullish. The same will be true in reverse.
The $17 target remains very probable.
Good luck!
Trade active
Monthly RSI closing under 50. Prepare for a sudden and progressive move down in the weeks ahead. No different from the move up when monthly RSI crossed up and over 50.Note
Expecting a relief rally to the $300 area, but don't get too excited. A 3-day death cross is approaching. As a life cross, it was very bullish (look left), same will be true in reverse. If the $300 level is broken with price action above $350, the idea can be cancelled.Trade active
Price action should now pick up speed to the $17 target following the rejection of the 200-week SMA. Look left. The last time this occurred after a rally price action dropped over 90%. Will this time be different?Trade active
Making good progress only another $63 to go.Note
Should see a bounce from here soonish...The Bitcoin pair is on the 200-week Moving averages as shown on the 1-day chart below with a 'incredible buy' signal.
Will be studying the bounce to see if it warrants closing this idea. Ask me later if I'm not updating, not always watching this one.
Trade active
1st target met, $74.Onwards and downwards to $17
Trade active
Note
Watch the monthly close carefully by July end. Below $80? Get out.Note
A couple of updates ago I said the 75-80 must hold to prevent further falls. That level has failed. There is now nothing to arrest price action until $17.Note
Aplenty were the calls for higher highs when this idea was published.. 70% correction later.For the bulls that remain, this is a warning. Price action must stay above $70. If it breaks to the underside of this channel on the weekly then a further 90% correction is highly probable. This is not my opinion, it is a fact of the chart.
Ww
Weekly chart
Note
Had a few messages asking if this idea remains active. Astonishingly some bought at the time this idea was published, even after reading the idea.GRM support has confirmed on the daily chart. That's good if you're long. However lower highs are continuing to print. In order to reverse the trend you MUST see price action recover
On the bigger picture the trend remains, a downtrend. Price action exited the bear flag, re-tested past support and confirmed as resistance. IF the
8-day chart
BTC
bc1q2eckdzh0q8vsd7swcc8et6ze7s99khhxyl7zwy
Weblink: patreon.com/withoutworries
Allow 3-6 months on ideas. Not investment advice. DYOR
bc1q2eckdzh0q8vsd7swcc8et6ze7s99khhxyl7zwy
Weblink: patreon.com/withoutworries
Allow 3-6 months on ideas. Not investment advice. DYOR
Disclaimer
The information and publications are not meant to be, and do not constitute, financial, investment, trading, or other types of advice or recommendations supplied or endorsed by TradingView. Read more in the Terms of Use.