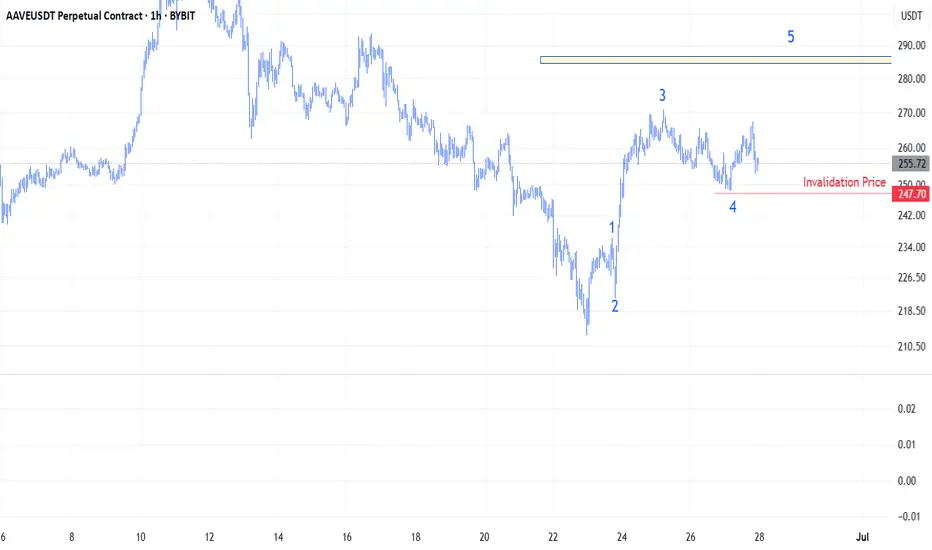
It appears on the chart that we are currently in Wave 4. Price is located between the 38.2% and 50% Fibonacci retracement levels of Wave 3, which is a common retracement zone for Wave 4. We observe a clearly formed three-wave corrective structure, with Wave C extending to 123.6% of Wave A,which is also a common target for Wave C. Additionally, there is hidden divergence between waves 2 and 4, which may indicate the potential for new highs ahead.Fibonacci cluster zones are pointing to potential targets near $285.
Disclaimer
The information and publications are not meant to be, and do not constitute, financial, investment, trading, or other types of advice or recommendations supplied or endorsed by TradingView. Read more in the Terms of Use.
Disclaimer
The information and publications are not meant to be, and do not constitute, financial, investment, trading, or other types of advice or recommendations supplied or endorsed by TradingView. Read more in the Terms of Use.