🔍 Technical Overview
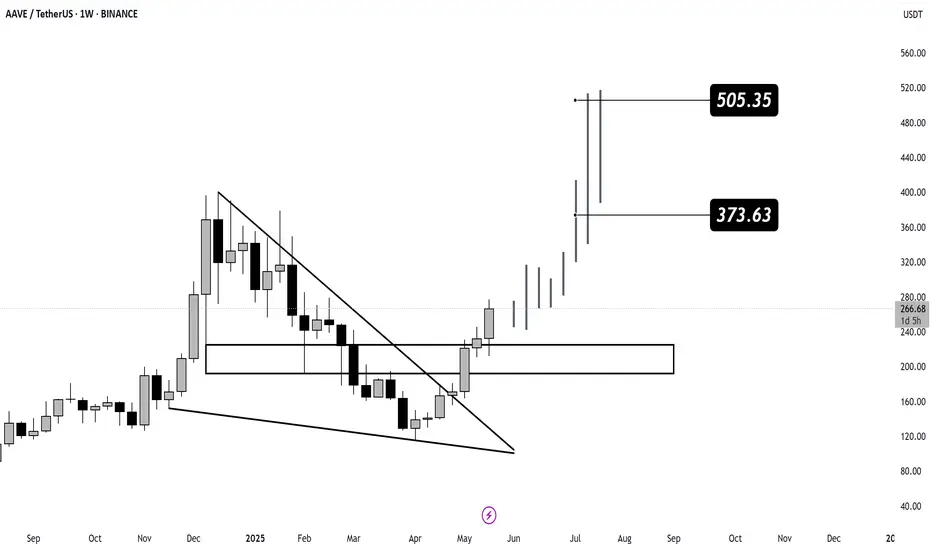
Pattern: Falling wedge (a bullish reversal formation).
Breakout: Clearly confirmed with strong bullish candles.
Support zone: Retested successfully around $160–$180 before continuation.
Current Price: ~$266.50
Weekly Gain: +14.81%
🎯 Upside Targets
Target 1: $373.63 — First major resistance zone.
Target 2: $505.35 — Long-term bullish target if momentum sustains.
📊 Interpretation
AAVE has completed a reversal structure and broken out with volume, suggesting strong bullish continuation.
Consolidation above $240–$250 will strengthen the move toward the next targets.
Failure to hold above $230 could signal a pullback retest before continuation.
✅ Summary
AAVE has shown a strong breakout from a long-term falling wedge, backed by volume and bullish structure. If market sentiment holds, the next targets are $373.63 and $505.35.
Subscribe to my Telegram Channel 👉 :
t.me/addlist/y5mi70s3c0Y3MDQ0
Subscribe to my X 👉 : x.com/VIPROSETR
t.me/addlist/y5mi70s3c0Y3MDQ0
Subscribe to my X 👉 : x.com/VIPROSETR
Disclaimer
The information and publications are not meant to be, and do not constitute, financial, investment, trading, or other types of advice or recommendations supplied or endorsed by TradingView. Read more in the Terms of Use.