** risky investment opportunity, $200m market capital **
Happy with the risk?
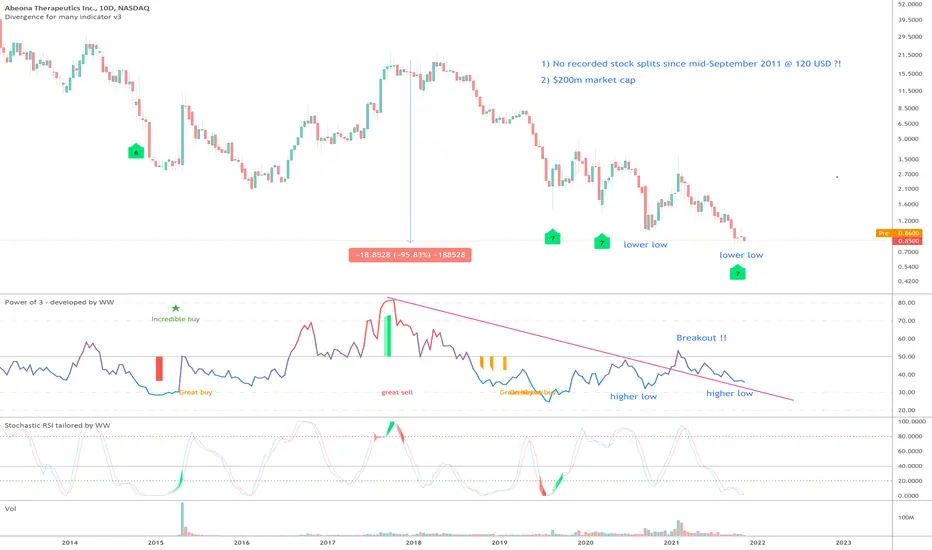
On the above 10-day chart price action has corrected a massive 95% from a high of $20 in early 2018. A number of reasons now exist to be bullish. Why?
1) Bullish divergences. Since the ‘great buy’ signal price action has continued to print lower lows while higher lows are printing with the oscillators. The monthly chart below provides a better overall illustration. Currently 7 oscillators are diverging with price action.
2) RSI resistance. After an extensive period RSI has broken resistance. This is clearly visible on both 10-day and monthly charts.
3) Volume. On the 3-month chart (bottom) volume continues to flow in as price action dips. I’ve not idea why, someone knows something I don’t. Follow the money.
Is it possible for price action to fall further? For sure.
Is it probable? Unlikely. A buy from < $2.80 is excellent.
Good luck!
WW
Monthly chart bullish divergences

3-month chart - volume

Happy with the risk?
On the above 10-day chart price action has corrected a massive 95% from a high of $20 in early 2018. A number of reasons now exist to be bullish. Why?
1) Bullish divergences. Since the ‘great buy’ signal price action has continued to print lower lows while higher lows are printing with the oscillators. The monthly chart below provides a better overall illustration. Currently 7 oscillators are diverging with price action.
2) RSI resistance. After an extensive period RSI has broken resistance. This is clearly visible on both 10-day and monthly charts.
3) Volume. On the 3-month chart (bottom) volume continues to flow in as price action dips. I’ve not idea why, someone knows something I don’t. Follow the money.
Is it possible for price action to fall further? For sure.
Is it probable? Unlikely. A buy from < $2.80 is excellent.
Good luck!
WW
Monthly chart bullish divergences
3-month chart - volume
Trade active
Support on past resistance - good to go.Note
There goes that support! Going to leave this open, under buy price and massively oversold on the daily, way outside the Bollinger Band.Trade active
I know this one has been awful from the get go.. price action is now squeezing into a falling wedge with 'incredible buy' signal on the 10-day chart below.Note
There was a 25/1 share split recently. On the 2-week chart double buy signals prints with bullish divergence.
Trade active
Volume confirms above signal.BTC
bc1q2eckdzh0q8vsd7swcc8et6ze7s99khhxyl7zwy
Weblink: patreon.com/withoutworries
Allow 3-6 months on ideas. Not investment advice. DYOR
bc1q2eckdzh0q8vsd7swcc8et6ze7s99khhxyl7zwy
Weblink: patreon.com/withoutworries
Allow 3-6 months on ideas. Not investment advice. DYOR
Disclaimer
The information and publications are not meant to be, and do not constitute, financial, investment, trading, or other types of advice or recommendations supplied or endorsed by TradingView. Read more in the Terms of Use.
BTC
bc1q2eckdzh0q8vsd7swcc8et6ze7s99khhxyl7zwy
Weblink: patreon.com/withoutworries
Allow 3-6 months on ideas. Not investment advice. DYOR
bc1q2eckdzh0q8vsd7swcc8et6ze7s99khhxyl7zwy
Weblink: patreon.com/withoutworries
Allow 3-6 months on ideas. Not investment advice. DYOR
Disclaimer
The information and publications are not meant to be, and do not constitute, financial, investment, trading, or other types of advice or recommendations supplied or endorsed by TradingView. Read more in the Terms of Use.