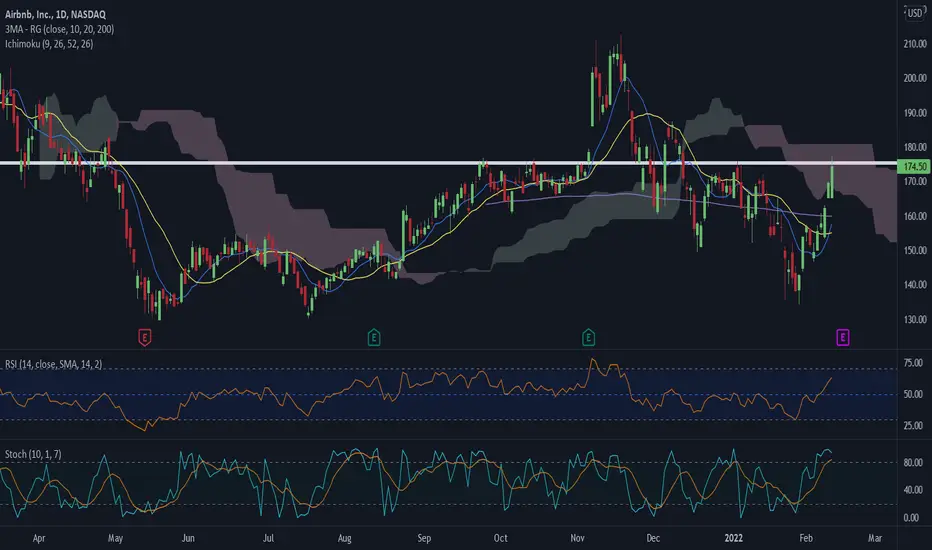
Line shows resistance at 175-176. Stock has been cut down since it peaked over 200, but this next ER may humble its valuation some more. I bought 18Feb 160 puts today.
Take a peak at the weekly chart. Has me wondering if this will reverse down to 120-100 or if ER will show it is worth 200+.
Take a peak at the weekly chart. Has me wondering if this will reverse down to 120-100 or if ER will show it is worth 200+.
Trade closed manually
Sold my puts on 11 Feb as they increased in value with higher IV and stock selling.Disclaimer
The information and publications are not meant to be, and do not constitute, financial, investment, trading, or other types of advice or recommendations supplied or endorsed by TradingView. Read more in the Terms of Use.
Disclaimer
The information and publications are not meant to be, and do not constitute, financial, investment, trading, or other types of advice or recommendations supplied or endorsed by TradingView. Read more in the Terms of Use.