Hello, traders.
If you "Follow", you can always get the latest information quickly.
Have a nice day today.
-------------------------------------
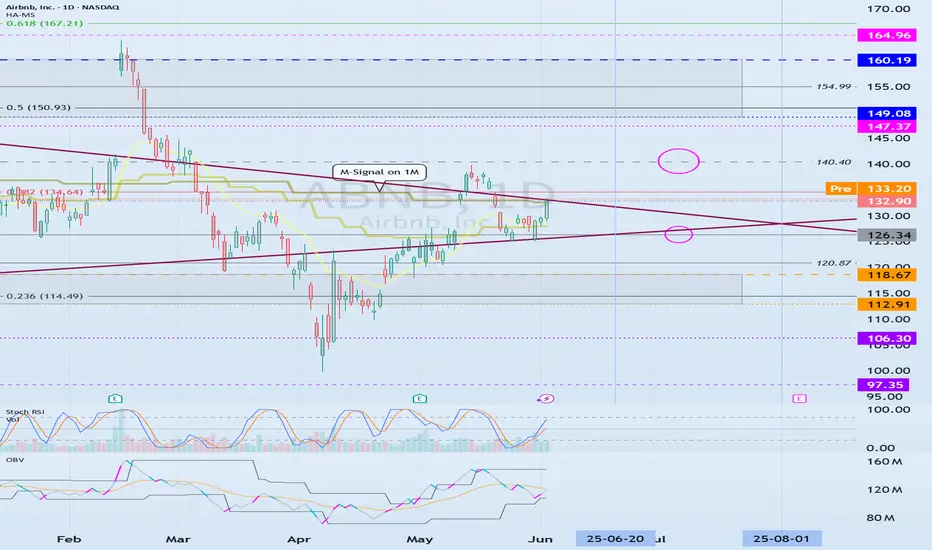
(ABNB 1D chart)
The key is whether it can hold the price by rising above the M-Signal indicator on the 1M chart.
If the price breaks through the triangle convergence upward this time and maintains, there is expected to be a big change in the trend around June 20 and August 1.
Support zone: 112.91-118.67
Resistance zone: 149.08-160.19
The selling zone is formed around 126.34.
-
Thank you for reading to the end.
I hope you have a successful transaction.
--------------------------------------------------
Trade active
#ABNBThe key is whether it can rise above 140.40 after receiving support near 134.64-136.08.
If the price stays above the M-Signal indicator on the 1M chart or the triangle converging trend line, it is expected to show a large upward trend.
At this time, we need to look at whether it can rise above the resistance zone of 149.08-160.19.
Other content (coins, stocks, etc.) is frequently posted on X.
X에 다른 내용(코인, 주식 등)이 자주 게시.
◆ t.me/readCryptoChannel
[HA-MS Indicator]
bit.ly/3YxHgvN
[OBV Indicator]
bit.ly/4dcyny3
X에 다른 내용(코인, 주식 등)이 자주 게시.
◆ t.me/readCryptoChannel
[HA-MS Indicator]
bit.ly/3YxHgvN
[OBV Indicator]
bit.ly/4dcyny3
Disclaimer
The information and publications are not meant to be, and do not constitute, financial, investment, trading, or other types of advice or recommendations supplied or endorsed by TradingView. Read more in the Terms of Use.