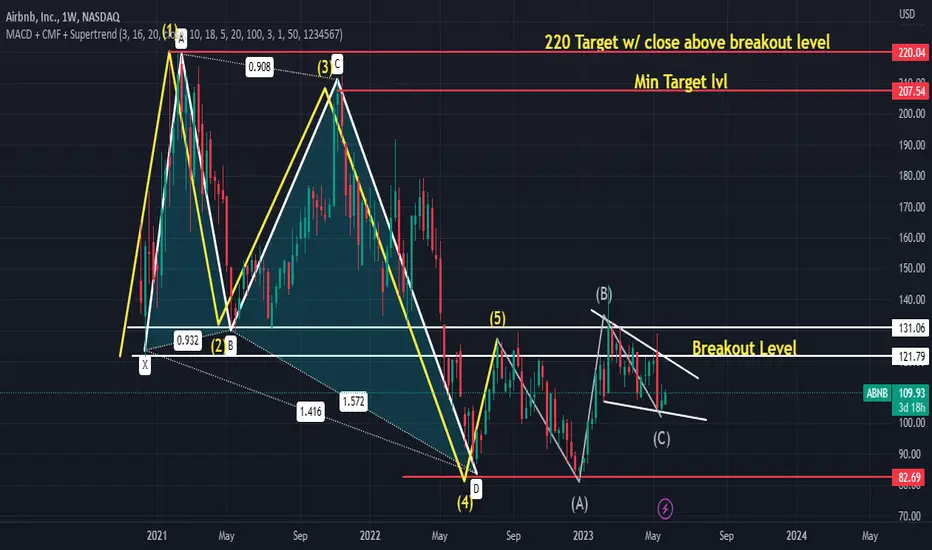
The AD is showing a bullish divergence on the Daily Chart, However on the weekly chart you'll notice a Bull Flag Set Up w/ a bullish Elliot Wave Count. Currently I have a C wave buy set up, but for less seasoned traders I highly recommend buying the confirm breakout.
Somethings to point out
1) you'll notice the 5th wave was rejected by the B leg of the bullish cypher pattern
2) B leg of the ABC pattern was also rejected by the B leg of the Bullish cypher pattern
3) Its important that these levels be flipped from resistances to support w/ a bullish close over both
4) I have 2 targets min. Target 207.50-$210 C leg retrace of the bullish cypher, and a Max $220 which is a X leg retrace of the bullish cypher pattern
Note
bullish divergence on the daily Note
by the ADNote
I haven't touched the chart since May. Monitor price action during and after fomc.. A retrace to 131 (back to wave 2/b leg) sets up a bull flag pattern... We have a potential bearish abcd pattern set up... Protect profitsNote
Note
would rather fill this gap now, rather than later Note
Note
30min chart, The AD is showing an Apex of the Triangle... Note
when overlapped w/ price action on 30min, I get $131 adding puts hereNote
Note
Will hop off short soon target Trade closed manually
cashed my putsDisclaimer
The information and publications are not meant to be, and do not constitute, financial, investment, trading, or other types of advice or recommendations supplied or endorsed by TradingView. Read more in the Terms of Use.
Disclaimer
The information and publications are not meant to be, and do not constitute, financial, investment, trading, or other types of advice or recommendations supplied or endorsed by TradingView. Read more in the Terms of Use.