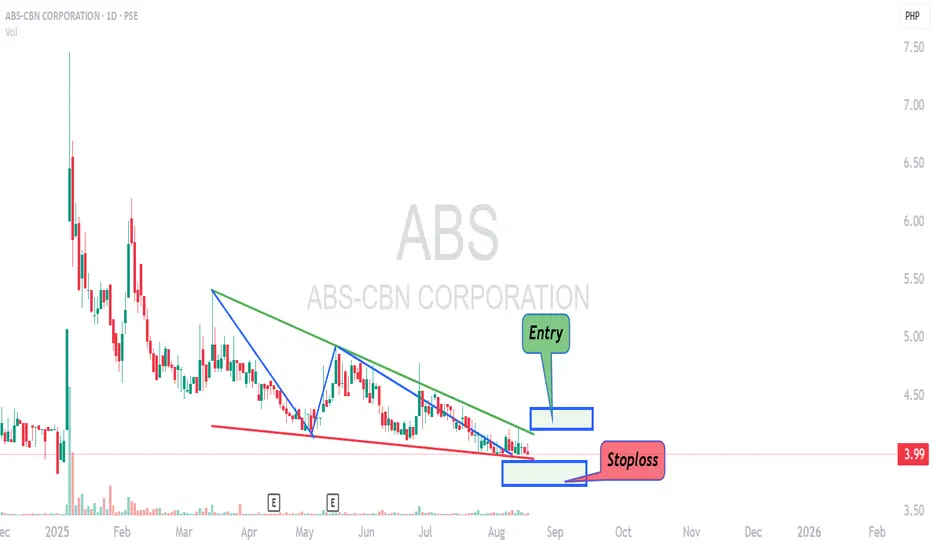
A Falling Wedge pattern showed up on ABS chart. It is a tradeable bullish reversal pattern. A falling wedge pattern is all about trendline resistance and trendline support. ABS price has been going up and down creating this narrowing range. If it breaks the trendline resistance then you have a bullish breakout. If it breaks the trendline support then you have a bearish breakout. Bearish breakout or what we call "breakdown" is useless right now in PSE market since there is no shorting available to retail traders yet as of writing this analysis.
This trade is very simple. There is a trendline resistance at 4.2 pesos. If the price breaks it or if the price goes up to 4.21 or higher then you can enter. You are entering on a breakout of the upper line of the Falling Wedge pattern. Upon entry, you set your stoploss at 3.94 pesos. That is the price below the lower line of the pattern. That gives you an exit if the price ever breaks the lower line.
Lets talk about risk. How much risk are you taking on this trade? Well, to do that, you measure from 4.21 pesos down to 3.94 pesos. That is over 6 percent. If you take this trade then you are looking at a potential 6 percent loss. The risk will vary depending on what price you have entered.
This is a bullish reversal trade. I gave you an entry price and a cutloss price. Your exit with gain will come from a different chart pattern. A bearish reversal one.
Thank you. Goodluck on your trade. May you trade well.
Traders Den PH
blogs.tradersdenph.com
blogs.tradersdenph.com
Disclaimer
The information and publications are not meant to be, and do not constitute, financial, investment, trading, or other types of advice or recommendations supplied or endorsed by TradingView. Read more in the Terms of Use.
Traders Den PH
blogs.tradersdenph.com
blogs.tradersdenph.com
Disclaimer
The information and publications are not meant to be, and do not constitute, financial, investment, trading, or other types of advice or recommendations supplied or endorsed by TradingView. Read more in the Terms of Use.