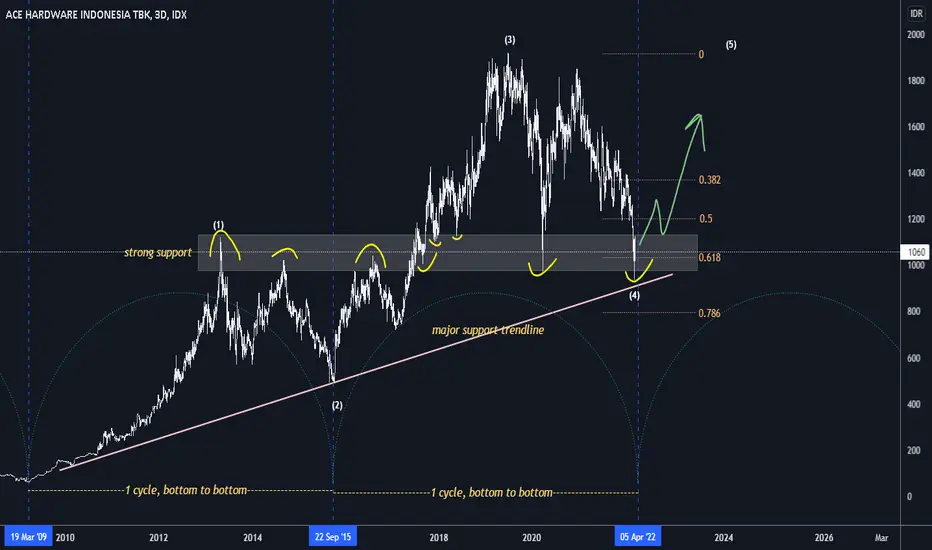
Summary : buy on weakness, buy on support area
Key points:
Price hovering around strong support area, coincides with 0.618 fibo level
Price bounds back on major support trend line
Historic cycle analysis shows major bottom in blue vertical line, if repeats, price should react within this time window
Key points:
Price hovering around strong support area, coincides with 0.618 fibo level
Price bounds back on major support trend line
Historic cycle analysis shows major bottom in blue vertical line, if repeats, price should react within this time window
Disclaimer
The information and publications are not meant to be, and do not constitute, financial, investment, trading, or other types of advice or recommendations supplied or endorsed by TradingView. Read more in the Terms of Use.
Disclaimer
The information and publications are not meant to be, and do not constitute, financial, investment, trading, or other types of advice or recommendations supplied or endorsed by TradingView. Read more in the Terms of Use.