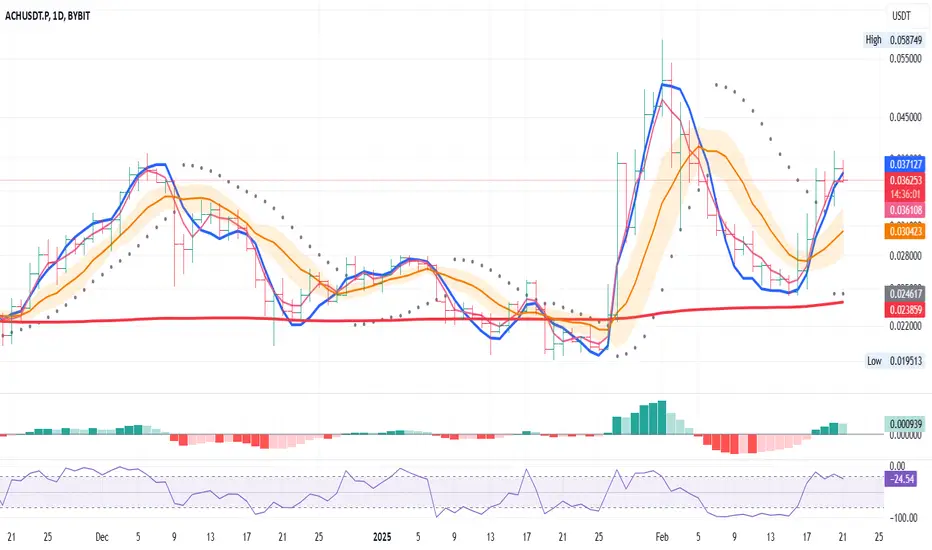
Based on the daily chart for ACHUSDT on Bybit, here's a concise analysis:
MLR vs. SMA: The MLR (blue) is above the SMA (pink), indicating a bullish trend.
MLR vs. BB Center: The MLR is above the BB Center Line (orange), suggesting bullish momentum.
PSAR: The PSAR dots (black) are under the price, confirming a bullish trend.
Price vs. SMA 200: The price is above the 200-period SMA (red), supporting a long-term bullish trend.
Current Strategy: Since all entry conditions for a long position are met (MLR above SMA, MLR above BB Center, PSAR under price, price above SMA 200), you might consider entering a long position. You can enter now or wait for the close of the day, depending on your availability. Waiting for the close of the day would be preferred to confirm the trend.
Stop Loss (SL): Set the stop loss at the current level of the PSAR dots to manage risk.
Monitor My Idea: Keep monitoring my idea for any changes in trend or potential profit-taking opportunities.
Note
TRADE STILL ACTIVE Note
The MLR has crossed the SMA. We have two options: either close the trade now or wait for the stop-loss (SL) of the PSAR to be triggered. It's your choice.Trade active
The MLR has crossed the SMA. We have two options: either close the trade now or wait for the stop-loss (SL) of the PSAR to be triggered. It's your choice.Disclaimer
The information and publications are not meant to be, and do not constitute, financial, investment, trading, or other types of advice or recommendations supplied or endorsed by TradingView. Read more in the Terms of Use.
Disclaimer
The information and publications are not meant to be, and do not constitute, financial, investment, trading, or other types of advice or recommendations supplied or endorsed by TradingView. Read more in the Terms of Use.