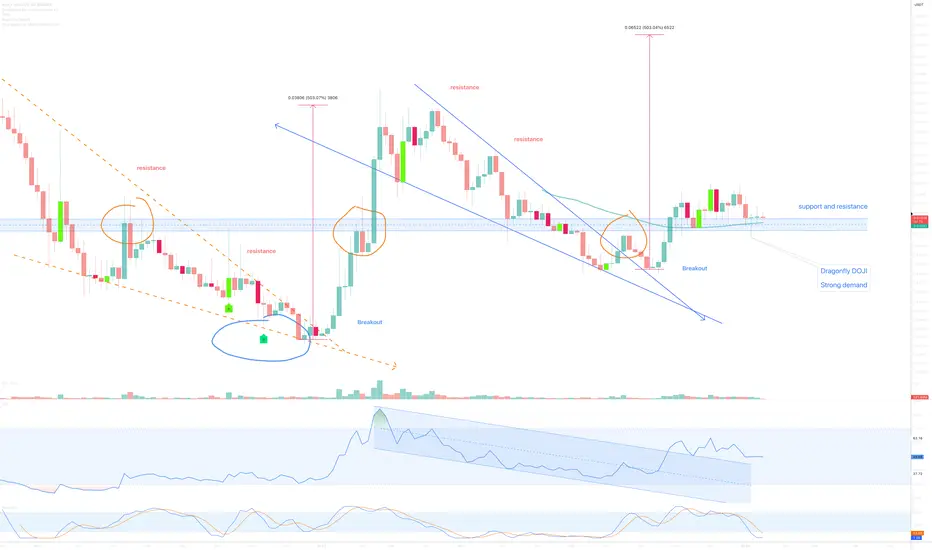
On the above 5-day chart price action has corrected almost 80% since the 500% move from the previous idea. Now is a good opportunity to go long. Why?
1) Price action and RSI resistance breakouts.
2) Trend reversal, higher highs and higher lows replace lower highs and lower lows.
3) Price action finds strong demand on past resistance. Orange circles. Look left.
4) Dragonfly DOJI candle print. On this timeframe, you don’t ignore.
5) There is something else, will share elsewhere.
Is it possible price action could fall further? Sure.
Is it probable? No.
Ww
Type: trade
Risk: <=6% of portfolio
Timeframe for long: Now
Return: 300%
Note
A 40% correction might be seen to past resistance for support confirmation.Note
Long from 0.022Note
As per last update, from 0.022. But right now, a big no no. 5 day chart is quite bearish.5 day chart
Trade active
Long positions from now.Trade closed: stop reached
Market structure was broken in the last week, never noticed. Someone asked. If you don't ask I'll no update!If price action does not print a volume sized move over 25 cents, you should expect a further 30% correction.
3 day
BTC
bc1q2eckdzh0q8vsd7swcc8et6ze7s99khhxyl7zwy
Weblink: patreon.com/withoutworries
Allow 3-6 months on ideas. Not investment advice. DYOR
bc1q2eckdzh0q8vsd7swcc8et6ze7s99khhxyl7zwy
Weblink: patreon.com/withoutworries
Allow 3-6 months on ideas. Not investment advice. DYOR
Related publications
Disclaimer
The information and publications are not meant to be, and do not constitute, financial, investment, trading, or other types of advice or recommendations supplied or endorsed by TradingView. Read more in the Terms of Use.