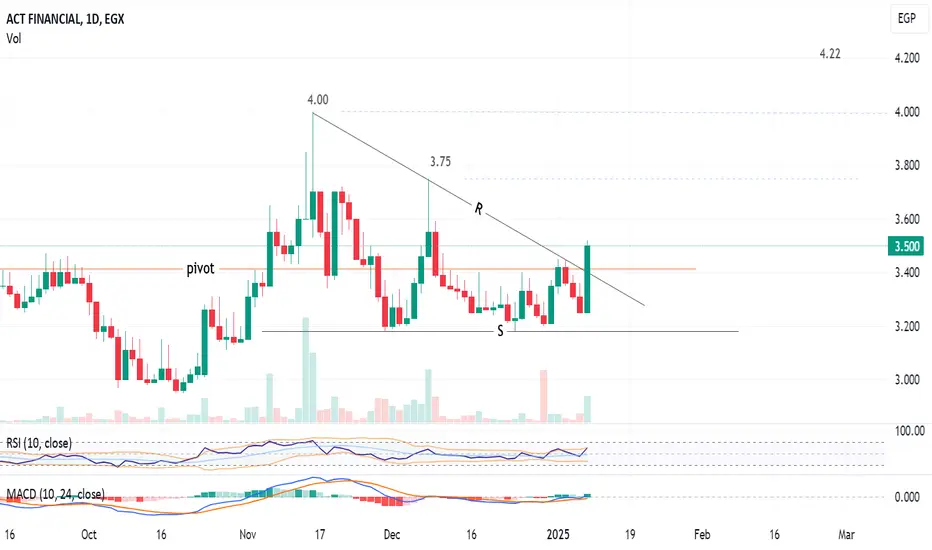
Daily chart, the stock  ACTF formed a chart pattern (triangle), and the price penetrated the resistance line R.
The target is 4.22 passing through resistance levels 3.60, 3.75 and 4.00
A re-test to line R / pivot level down to 3.40 - 3.37 may happen before the bullish movement.
So, watch carefully and consider a dynamic stop loss level.
MACD is supporting the positive view.
The target is 4.22 passing through resistance levels 3.60, 3.75 and 4.00
A re-test to line R / pivot level down to 3.40 - 3.37 may happen before the bullish movement.
So, watch carefully and consider a dynamic stop loss level.
MACD is supporting the positive view.
Disclaimer
The information and publications are not meant to be, and do not constitute, financial, investment, trading, or other types of advice or recommendations supplied or endorsed by TradingView. Read more in the Terms of Use.
Disclaimer
The information and publications are not meant to be, and do not constitute, financial, investment, trading, or other types of advice or recommendations supplied or endorsed by TradingView. Read more in the Terms of Use.