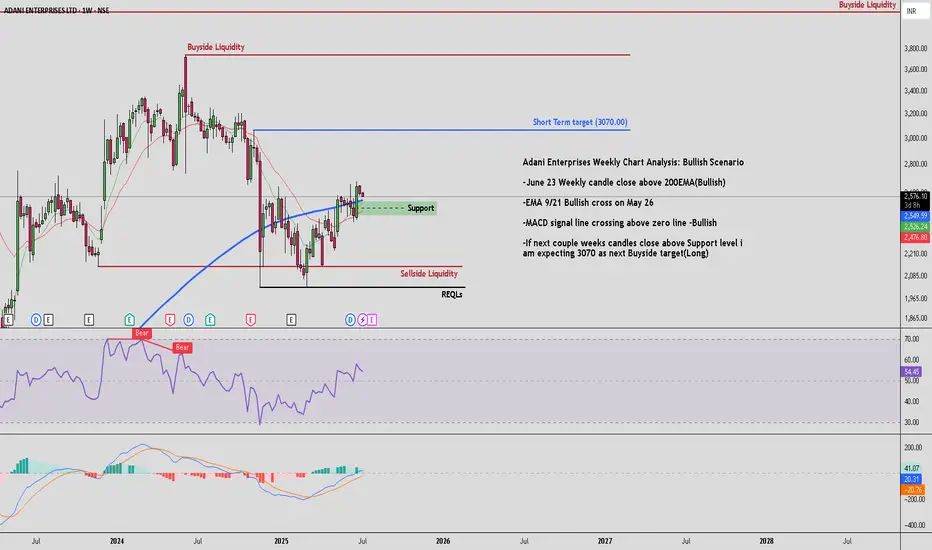
Adani Enterprises Weekly Chart Analysis: Bullish Scenario
-June 23 Weekly candle close above 200EMA(Bullish)
-EMA 9/21 Bullish cross on May 26
-MACD signal line crossing above zero line -Bullish
-If next couple weeks candles close above Support level i am expecting 3070 as next Buyside target(Long)
-June 23 Weekly candle close above 200EMA(Bullish)
-EMA 9/21 Bullish cross on May 26
-MACD signal line crossing above zero line -Bullish
-If next couple weeks candles close above Support level i am expecting 3070 as next Buyside target(Long)
Disclaimer
The information and publications are not meant to be, and do not constitute, financial, investment, trading, or other types of advice or recommendations supplied or endorsed by TradingView. Read more in the Terms of Use.
Disclaimer
The information and publications are not meant to be, and do not constitute, financial, investment, trading, or other types of advice or recommendations supplied or endorsed by TradingView. Read more in the Terms of Use.