Hey!
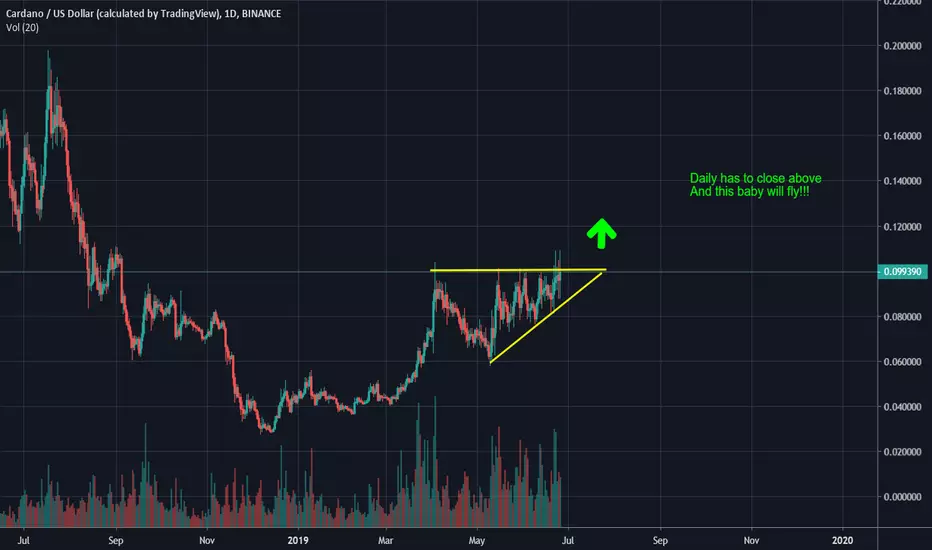
So here we can see ADA hitting against the resistance over and over again.
The idea is that as a trendline is being retested over and over again,
then the Price intends to be broken in that given direction.
All we need is closing on the Daily Candle above that given resistance here and push with a decent Volume.
Follow for more easy visualizations like that.
Good Luck Trading! :)
Note
We couldn't close the daily above this resistance = we failed and broke down.No trade taken here. : )
Disclaimer
The information and publications are not meant to be, and do not constitute, financial, investment, trading, or other types of advice or recommendations supplied or endorsed by TradingView. Read more in the Terms of Use.
Disclaimer
The information and publications are not meant to be, and do not constitute, financial, investment, trading, or other types of advice or recommendations supplied or endorsed by TradingView. Read more in the Terms of Use.
