🔄 When Time Speaks, Price Listens
#TimeAnalysis | #Cardano | #ADAUSDT | #SmartTrading
In my previous ADA/USDT analysis, the mistake wasn’t in the price structure—it was in the timing.
The price didn’t reverse where expected, not because the setup was wrong, but because I ignored one critical factor:
The time cycle must align with the price cycle.
📌 Here's what really happened:
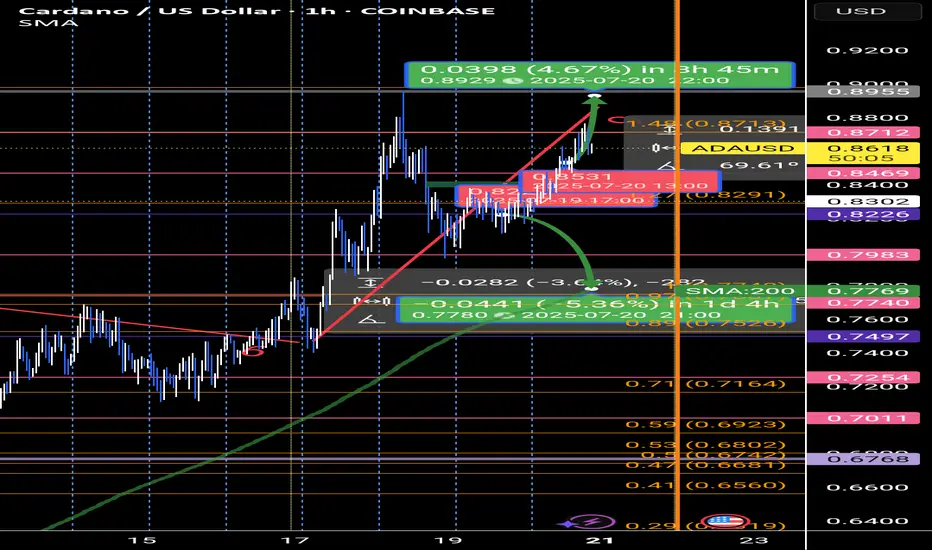
From July 2 to July 7, price moved sideways in a clear accumulation range.
Then came an explosive expansion wave (Wave 3) from 0.573 to 0.75, lasting 113 hourly candles.
This was followed by a correction wave (Wave 6) of 130 candles.
Currently, price is in a distribution wave (Wave 9), ongoing for over 90 candles.
📉 My error? Misalignment between time and price.
📆 After applying my fixed monthly time cycle model, based on the rule that 9 marks the end of every cycle,
it became obvious that the price waves were following exact temporal intervals:
➡️ Monthly cycle anchor points:
(8 Jan, 7 Feb, 6 Mar, ..., 9 Sep, 8 Oct...)
Each month is divided into 3 major time zones, and each zone into two sub-zones.
This creates a clean framework where waves naturally unfold:
🔹 3 = Expansion
🔹 6 = Correction
🔹 9 = Distribution
💡 Key Takeaways:
Don’t trade predictions. Trade the wave.
Every price move is governed by time.
Ignoring time leads to premature entries—even with solid technical analysis.
🧠 Want to learn how to read these time-price cycles? Let’s discuss in the comments.
#TimeAnalysis | #Cardano | #ADAUSDT | #SmartTrading
In my previous ADA/USDT analysis, the mistake wasn’t in the price structure—it was in the timing.
The price didn’t reverse where expected, not because the setup was wrong, but because I ignored one critical factor:
The time cycle must align with the price cycle.
📌 Here's what really happened:
From July 2 to July 7, price moved sideways in a clear accumulation range.
Then came an explosive expansion wave (Wave 3) from 0.573 to 0.75, lasting 113 hourly candles.
This was followed by a correction wave (Wave 6) of 130 candles.
Currently, price is in a distribution wave (Wave 9), ongoing for over 90 candles.
📉 My error? Misalignment between time and price.
📆 After applying my fixed monthly time cycle model, based on the rule that 9 marks the end of every cycle,
it became obvious that the price waves were following exact temporal intervals:
➡️ Monthly cycle anchor points:
(8 Jan, 7 Feb, 6 Mar, ..., 9 Sep, 8 Oct...)
Each month is divided into 3 major time zones, and each zone into two sub-zones.
This creates a clean framework where waves naturally unfold:
🔹 3 = Expansion
🔹 6 = Correction
🔹 9 = Distribution
💡 Key Takeaways:
Don’t trade predictions. Trade the wave.
Every price move is governed by time.
Ignoring time leads to premature entries—even with solid technical analysis.
🧠 Want to learn how to read these time-price cycles? Let’s discuss in the comments.
Disclaimer
The information and publications are not meant to be, and do not constitute, financial, investment, trading, or other types of advice or recommendations supplied or endorsed by TradingView. Read more in the Terms of Use.
Disclaimer
The information and publications are not meant to be, and do not constitute, financial, investment, trading, or other types of advice or recommendations supplied or endorsed by TradingView. Read more in the Terms of Use.