Recent Performance: ADA price shows a notable overnight increase of 4.11%, maintaining the momentum with an intraday rise of 3.31%.
Bullish Continuation Expected: The ADA price trend signals a potential breakout past the crucial $0.70 mark, with eyes set on reclaiming the $1 level.
Weekly Chart Analysis: In the weekly timeframe, ADA marks significant growth, surging 163% in the past 12 weeks. A robust bounce from the $0.25 support level aligns ADA with the 38.20% Fibonacci retracement level at $0.70.
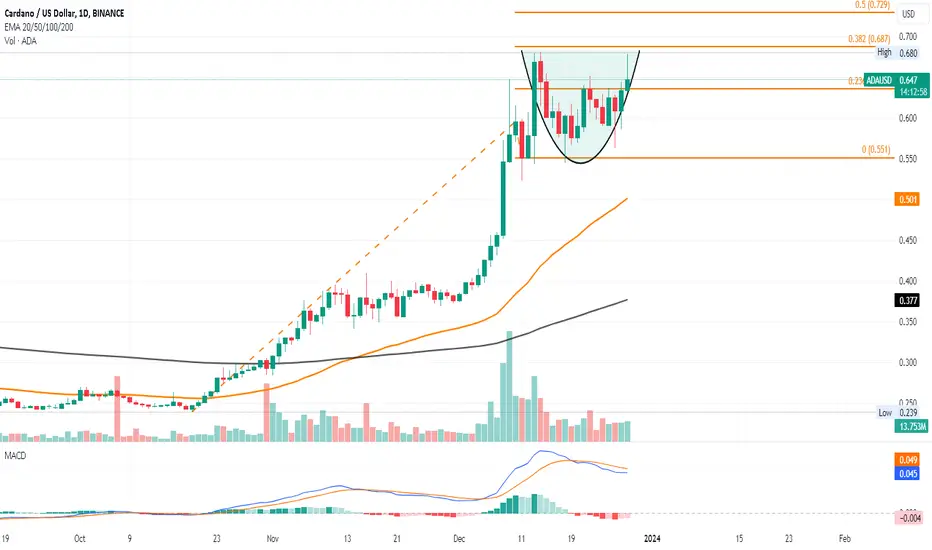
Potential Rounding Bottom Formation: The daily chart illustrates a possible rounding bottom pattern, indicating a bullish trend continuation. The neckline of this pattern aligns with the 38.20% Fibonacci level, further hinting at an upcoming breakout.
Current Trading Scenario: Trading at $0.648, ADA faces resistance near the $0.70 level. Despite some higher price rejection, the overall trend appears bullish.
Technical Indicators Show Positive Signs:
EMA: Both 50 and 200 EMAs are trending positively, hinting at a potential golden crossover—a bullish signal for ADA.
MACD: A possible bullish crossover on the horizon, as indicated by the recent upward movement and shrinking negative histograms.
Bullish Outlook: Should ADA maintain its bullish trend and successfully breach the $0.70 threshold, a rally towards the $1 mark is plausible.
Downside Risks: However, a downturn below $0.60 is possible, especially if ADA faces strong rejection at the $0.70 resistance level.
Bullish Continuation Expected: The ADA price trend signals a potential breakout past the crucial $0.70 mark, with eyes set on reclaiming the $1 level.
Weekly Chart Analysis: In the weekly timeframe, ADA marks significant growth, surging 163% in the past 12 weeks. A robust bounce from the $0.25 support level aligns ADA with the 38.20% Fibonacci retracement level at $0.70.
Potential Rounding Bottom Formation: The daily chart illustrates a possible rounding bottom pattern, indicating a bullish trend continuation. The neckline of this pattern aligns with the 38.20% Fibonacci level, further hinting at an upcoming breakout.
Current Trading Scenario: Trading at $0.648, ADA faces resistance near the $0.70 level. Despite some higher price rejection, the overall trend appears bullish.
Technical Indicators Show Positive Signs:
EMA: Both 50 and 200 EMAs are trending positively, hinting at a potential golden crossover—a bullish signal for ADA.
MACD: A possible bullish crossover on the horizon, as indicated by the recent upward movement and shrinking negative histograms.
Bullish Outlook: Should ADA maintain its bullish trend and successfully breach the $0.70 threshold, a rally towards the $1 mark is plausible.
Downside Risks: However, a downturn below $0.60 is possible, especially if ADA faces strong rejection at the $0.70 resistance level.
Disclaimer
The information and publications are not meant to be, and do not constitute, financial, investment, trading, or other types of advice or recommendations supplied or endorsed by TradingView. Read more in the Terms of Use.
Disclaimer
The information and publications are not meant to be, and do not constitute, financial, investment, trading, or other types of advice or recommendations supplied or endorsed by TradingView. Read more in the Terms of Use.