ADA/USDT Symmetrical Triangle Setup - Bullish Continuation Antic
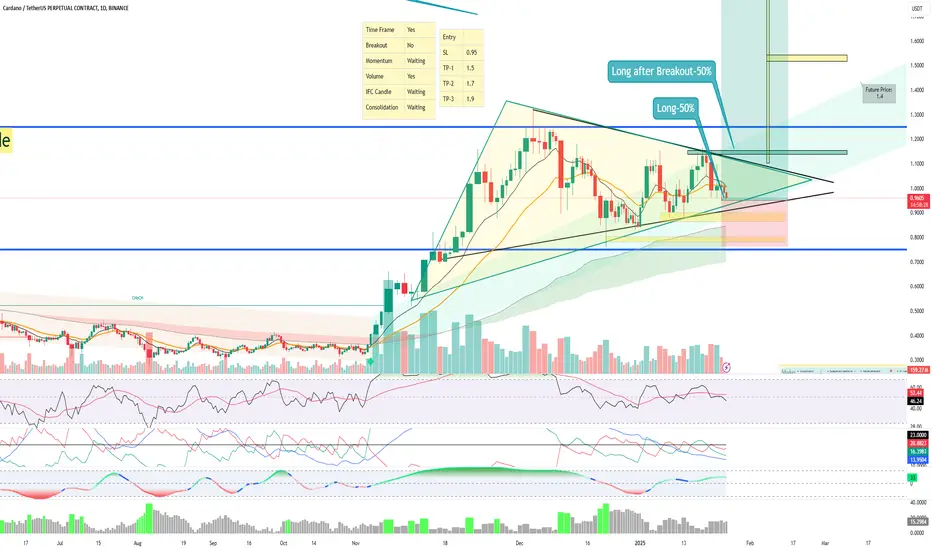
The ADA/USDT daily chart showcases a textbook symmetrical triangle pattern, indicating potential consolidation before a breakout. The following are key observations and trade details:
Price Structure: ADA has been consolidating within the triangle, forming higher lows and lower highs, indicative of reducing volatility.
The structure aligns with the broader trend, which appears bullish following a strong impulsive move in late 2024.
Volume:
Volume has been declining during consolidation, which is consistent with the triangle formation.
A breakout accompanied by a volume spike will confirm the move.
Indicators: RSI: Hovering near 46, suggesting neutral momentum and scope for upward movement.
ADX: Low levels (~13), reflecting a consolidation phase. Increasing ADX post-breakout would validate trend continuation.
MACD: Near-zero, awaiting a crossover that aligns with the breakout.
Key Levels:
Resistance: $1.10 (triangle upper boundary).
Support: $0.90 (triangle lower boundary).
Key breakout target: $1.40, derived from the triangle height.
Trade Setup:
Entry: Enter long 50% at breakout confirmation above $1.10. Add another 50% above $1.15 to confirm strength.
Stop Loss (SL): Tight stop below $0.95 to limit downside risk.
Take Profit (TP):
TP1: $1.50
TP2: $1.70
TP3: $1.90
Risk-Reward Ratio: Favorable > 3:1.
Conclusion: ADA is poised for a significant move as it approaches the apex of the triangle. A breakout above $1.10 aligns with bullish fundamentals and technical indicators. Patience is key—wait for confirmation before entering.
A Haque
Founder | MyTradingJournal
📊 Financial Market Analyst | Trader | Educator
🐦 Twitter: @MyTradingJnl6th
📺 YouTube: @MyTradingJournal6th
Founder | MyTradingJournal
📊 Financial Market Analyst | Trader | Educator
🐦 Twitter: @MyTradingJnl6th
📺 YouTube: @MyTradingJournal6th
Disclaimer
The information and publications are not meant to be, and do not constitute, financial, investment, trading, or other types of advice or recommendations supplied or endorsed by TradingView. Read more in the Terms of Use.