Here is the top-down analysis for  ADA as requested 🫡
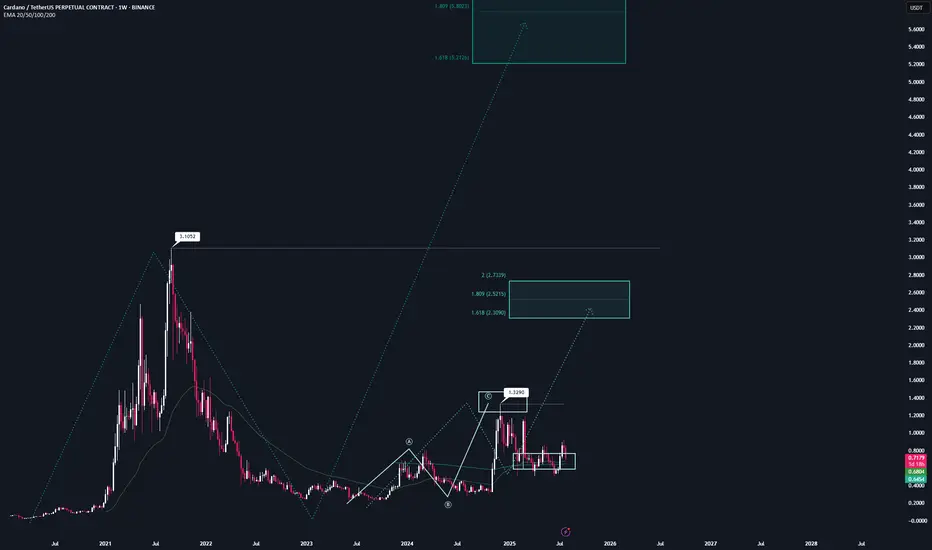
Weekly Timeframe:
We have one large potential sequence on the weekly chart that will be activated once we break the ATH at $3.1, with a target zone around $5.2. This is also my conservative target for this bull run, assuming we get the “altseason” everyone is hoping for.
We’ve also already completed a smaller sequence on the weekly chart and then corrected into the overall correction level.
If we break the November high at $1.3, we will also activate a new structure that could take us close to the ATH.

Daily Chart:
On the daily chart, we were rejected at the bearish reversal area (green) and corrected down into the B–C correction level, followed by a continuation into the target zone.
According to the rulebook, I expect a bounce from these regions and have positioned myself accordingly with 4 long orders — one at each level.

Local price action:
On the 4H chart, we have a bearish sequence that is counter to the primary scenario. Statistically, it’s less likely to play out, but it’s still worth noting.
The bearish reversal area (blue) is the next key level to watch if we get a bounce here.
If this area is broken, the follow-up move becomes very likely.


-----
Thats the my full Analysis forADA, hope it was helpful if you want me to do another analysis for any other pair just comment down below.
Also, if anyone is interested in how my trading system works, let me know and I’ll post some educational content about it.
Thanks for reading❤️
Weekly Timeframe:
We have one large potential sequence on the weekly chart that will be activated once we break the ATH at $3.1, with a target zone around $5.2. This is also my conservative target for this bull run, assuming we get the “altseason” everyone is hoping for.
We’ve also already completed a smaller sequence on the weekly chart and then corrected into the overall correction level.
If we break the November high at $1.3, we will also activate a new structure that could take us close to the ATH.
Daily Chart:
On the daily chart, we were rejected at the bearish reversal area (green) and corrected down into the B–C correction level, followed by a continuation into the target zone.
According to the rulebook, I expect a bounce from these regions and have positioned myself accordingly with 4 long orders — one at each level.
Local price action:
On the 4H chart, we have a bearish sequence that is counter to the primary scenario. Statistically, it’s less likely to play out, but it’s still worth noting.
The bearish reversal area (blue) is the next key level to watch if we get a bounce here.
If this area is broken, the follow-up move becomes very likely.
-----
Thats the my full Analysis for
Also, if anyone is interested in how my trading system works, let me know and I’ll post some educational content about it.
Thanks for reading❤️
Disclaimer
The information and publications are not meant to be, and do not constitute, financial, investment, trading, or other types of advice or recommendations supplied or endorsed by TradingView. Read more in the Terms of Use.
Disclaimer
The information and publications are not meant to be, and do not constitute, financial, investment, trading, or other types of advice or recommendations supplied or endorsed by TradingView. Read more in the Terms of Use.