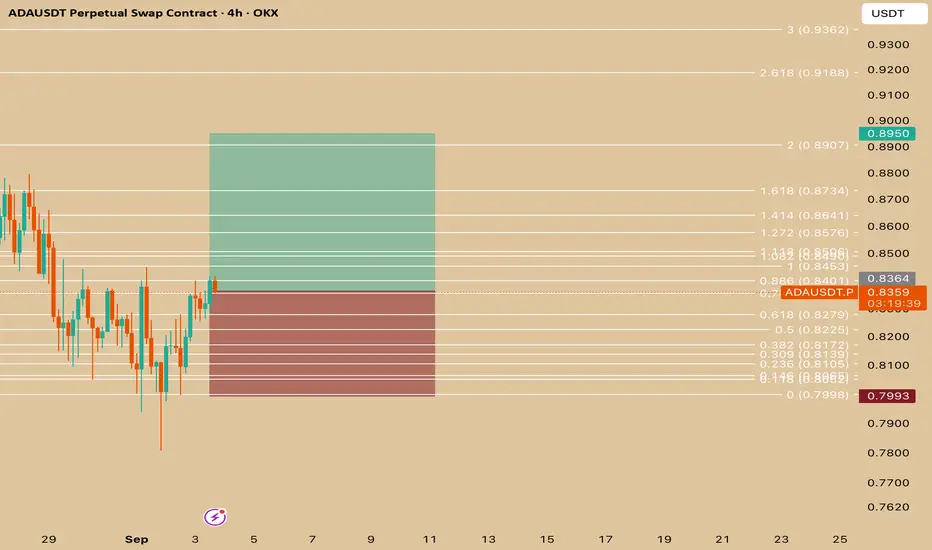
1. Pair and Timeframe
Asset: ADA/USDT (Cardano vs. Tether)
Timeframe: 4-hour (H4)
Exchange: OKX (Perpetual Swap Contract)
2. Chart Tools Used
Fibonacci retracement & extension levels: Drawn across a recent move to identify potential support, resistance, and target areas.
Risk-to-reward setup: Green (take profit zone) and red (stop loss zone) box mark the trade plan.
3. Trade Setup
Entry Zone: Around 0.836 USDT (current price).
Stop Loss: Around 0.799 USDT (bottom of red box, just below the 0 Fibonacci level).
Take Profit: Around 0.895 USDT (top of green box, close to the 2.0 Fib extension).
4. Idea Behind the Trade
Price bounced from the 0.618–0.786 Fib retracement area (a common reversal zone).
The trader is betting that ADA will continue upward toward the 1.618 – 2.0 Fibonacci extensions.
The risk-to-reward ratio looks favorable (roughly 1:2 or better).
5. Key Levels
Support levels:
0.827 (0.618 Fib)
0.810 (0.236 Fib)
0.799 (strong support, stop loss area)
Resistance levels / targets:
0.857 (1.272 Fib)
0.873 (1.618 Fib)
0.890 (2.0 Fib, main TP)
0.918+ (extended target if bullish momentum continues)
✅ In summary:
This is a long trade setup on ADAUSDT. The trader expects ADA to move higher from ~0.836 toward 0.895 (and possibly beyond), while limiting downside risk with a stop loss below 0.80. The strategy is based on Fibonacci retracement/extension levels and recent price action structure.
Do you want me to also calculate the exact risk-to-reward ratio (RRR) for this trade using the entry, stop, and target?
Disclaimer
The information and publications are not meant to be, and do not constitute, financial, investment, trading, or other types of advice or recommendations supplied or endorsed by TradingView. Read more in the Terms of Use.
Disclaimer
The information and publications are not meant to be, and do not constitute, financial, investment, trading, or other types of advice or recommendations supplied or endorsed by TradingView. Read more in the Terms of Use.