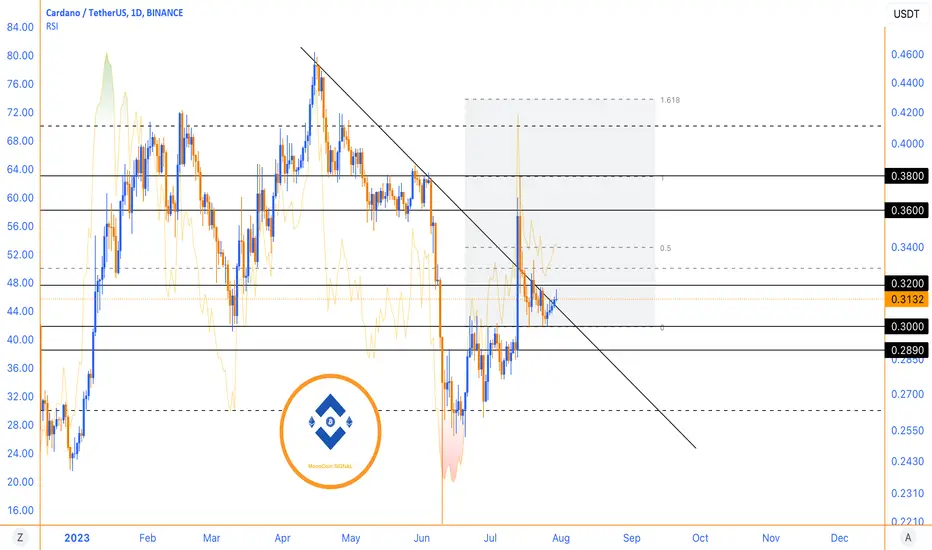
During the past days, ADA has reacted positively to its second support in the range of $0.30, and selling pressure has decreased on this support. The RSI level on a daily timeframe is currently at 52, suggesting a relatively balanced state of buying and selling pressures, neither indicating overbought nor oversold conditions.
The downtrend line drawn on the chart has been broken, indicating a potential shift in the market sentiment. However, despite this breakthrough, the buying power has not been enough to push the price up significantly, and there is still no strong indication that the price of Cardano is going up.
For a more convincing bullish scenario, a strong signal would be to see ADA break the resistance of the $0.32 range again and stabilize the price above this level. In this way, Cardano's higher targets will be in the range of $0.36 and $0.38. But until then, another downward swing from Cardano may be seen, and the RSI at 52 suggests that the market sentiment remains relatively neutral.
The fluctuation may continue until the starting range of the last bullish spike candle, i.e., the price of $0.289. If we see a positive reaction from this area, combined with an increase in buying pressure and a potential rise in the RSI, we can expect the growth of Cardano again.
In summary, the recent positive reaction from ADA's support levels, the break of the downtrend line, and the RSI at 52 indicate a somewhat balanced market. To confirm a more definite upward movement, breaking the resistance at $0.32 and observing a potential rise in the RSI will be crucial. Until then, caution should be exercised, as the price might experience fluctuations and may retest the starting range of the last bullish spike.
Join our channel:
🔵 t.me/monocoin_public
🟠 t.me/monocoin_public
🔵 t.me/monocoin_public
🟠 t.me/monocoin_public
🔵 t.me/monocoin_public
🟠 t.me/monocoin_public
🔵 t.me/monocoin_public
🟠 t.me/monocoin_public
Disclaimer
The information and publications are not meant to be, and do not constitute, financial, investment, trading, or other types of advice or recommendations supplied or endorsed by TradingView. Read more in the Terms of Use.