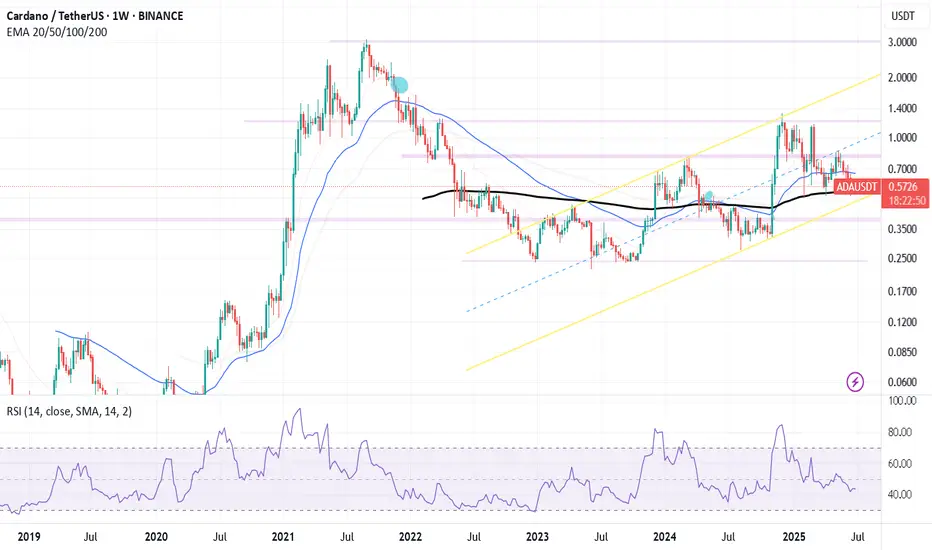
This chart includes two simple moving averages (50-day and 200-day) along with the RSI indicator to help spot potential trend changes and momentum in Bitcoin.
It’s set to the daily timeframe for broader swing analysis.
Great for identifying support/resistance zones and golden/death cross signals.
Disclaimer
The information and publications are not meant to be, and do not constitute, financial, investment, trading, or other types of advice or recommendations supplied or endorsed by TradingView. Read more in the Terms of Use.
Disclaimer
The information and publications are not meant to be, and do not constitute, financial, investment, trading, or other types of advice or recommendations supplied or endorsed by TradingView. Read more in the Terms of Use.