Hello everyone.
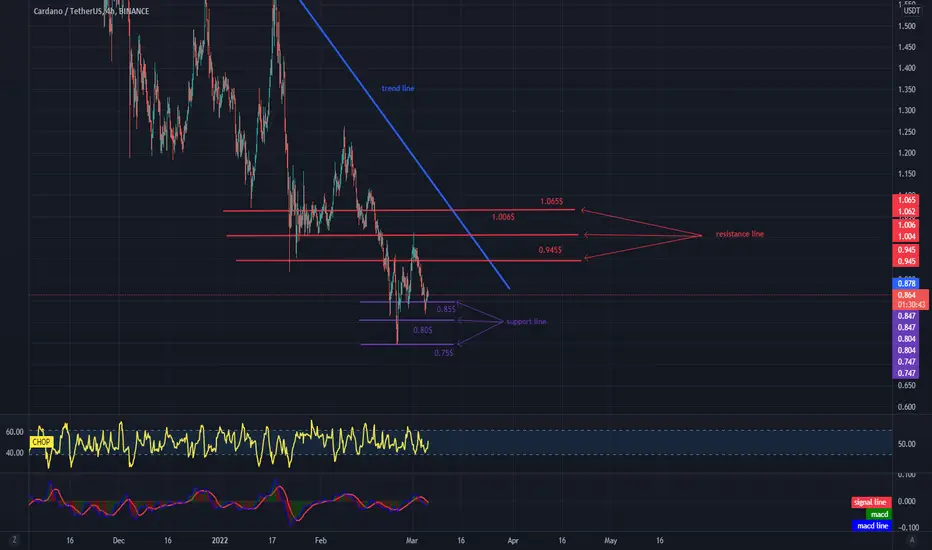
Let's take a look at the ADA to USDT chart on the 4H time frame.
Note the blue line that marks the downtrend, as you can see the price is moving underneath it.
Now let's move on to determining the support line that the price should encounter in the event of a further correction and you can see that the first support is at the price of $ 0.85, if the support does not maintain the price, the next one is at the price of $ 0.80 and the next support at $ 0.75.
Looking the other way, it is worth drawing resistance lines that the price must overcome if the price starts to rise, the first resistance will appear at $ 0.945, and the next resistance at $ 1.006 and $ 1.065.
On the CHOP indicator you can see that in the 4H interval we gain more and more energy that can be used for the next move.
Disclaimer
The information and publications are not meant to be, and do not constitute, financial, investment, trading, or other types of advice or recommendations supplied or endorsed by TradingView. Read more in the Terms of Use.
Disclaimer
The information and publications are not meant to be, and do not constitute, financial, investment, trading, or other types of advice or recommendations supplied or endorsed by TradingView. Read more in the Terms of Use.