hi traders
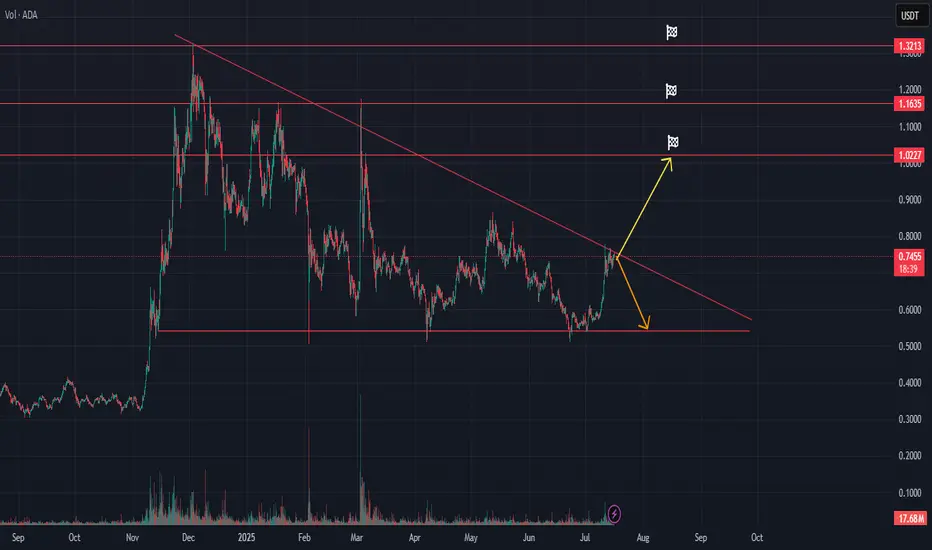
This technical analysis for Cardano (ADA/USDT) outlines a potential breakout or rejection scenario as the price tests a long-term descending trendline.
Key Technical Levels to watch:
Resistance:
$0.7467 (current test of descending trendline)
$1.0227 (primary breakout target)
$1.1635
$1.3213
Support:
~$0.60 (horizontal support zone)
Trendline: The chart features a long-term descending trendline from the February/March 2025 highs. ADA is currently approaching this resistance after a sustained rally from sub-$0.60 levels.
📈 Bullish Scenario:
If ADA breaks above the descending trendline with strong volume:
Expect a continuation move toward $1.0227, the nearest key resistance.
A successful breakout and hold above $1.0227 could open the path toward $1.1635 and eventually $1.3213.
This would signal a potential trend reversal and shift in momentum.
📉 Bearish Scenario:
If ADA gets rejected at the trendline:
Price may fall back toward the $0.60 support zone, where previous consolidation occurred.
This scenario suggests the trendline remains a strong barrier and that ADA may continue ranging or resume a downtrend.
*How to trade it:
Confirm breakout with volume and daily candle close.
Watch for fakeouts or failed breakouts due to market-wide sentiment shifts.
💥 Free signals and ideas ➡ t.me/vfinvestment
Disclaimer
The information and publications are not meant to be, and do not constitute, financial, investment, trading, or other types of advice or recommendations supplied or endorsed by TradingView. Read more in the Terms of Use.
💥 Free signals and ideas ➡ t.me/vfinvestment
Disclaimer
The information and publications are not meant to be, and do not constitute, financial, investment, trading, or other types of advice or recommendations supplied or endorsed by TradingView. Read more in the Terms of Use.