🔰 ADA/USDT – Strategic Analysis (Spring 2025)
Powered by Zarvān | Dynamic Field S/R Engine
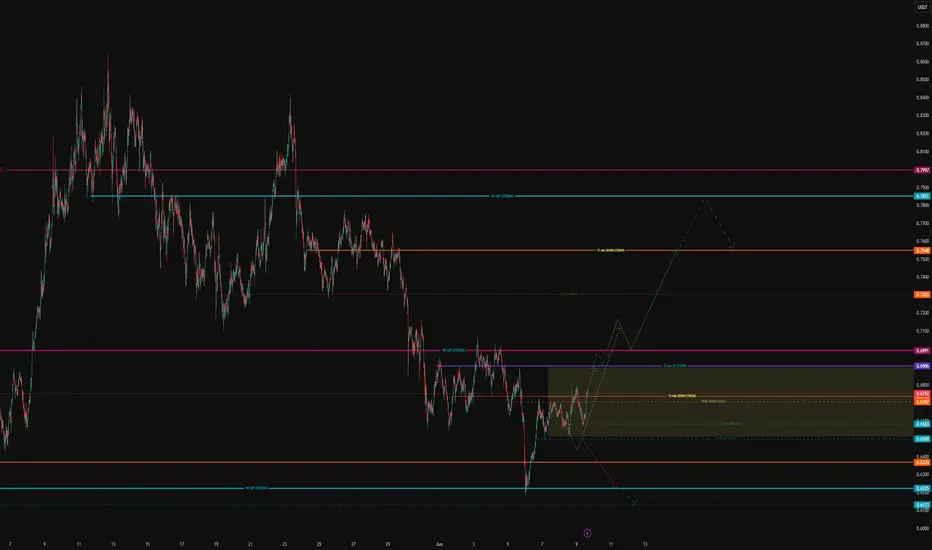
ADA/USDT is now trading inside a crucial decision zone, highlighted by the golden background on the chart. This area marks a period of market indecision—typically a precursor to a strong breakout move in either direction.
Dynamic Support: 0.6580 – If this level fails, watch for the next support at 0.6430, and, in extension, 0.6225.
Dynamic Resistance: 0.6991 – This is the key short-term resistance. A confirmed breakout here opens the path towards 0.7540 and potentially 0.7851.
Major Resistance: 0.7997
Potential Scenarios:
Bullish Outlook:
Should ADA/USDT decisively break and hold above 0.6991, a rapid move towards 0.7540—and possibly higher to 0.7851—is on the table. (Green projection on chart)
Bearish Outlook:
Conversely, losing the 0.6580 support level could trigger a drop to 0.6430, then 0.6225. (Red projection)
What Makes This Analysis Unique?
This forecast is built upon a suite of proprietary Zarvān indicators, not available to the general public. These include:
Zarvān | Dynamic Support & Resistance (Divergence-Based)
A smart, adaptive S/R system built on divergence, structural bias, and market energy—not simple pivots or Fibonacci retracements.
Zarvān | Composite Field Engine
Measures “hidden field energy,” imbalance, and latent reversal potential using a layered logic unique to the Zarvān methodology.
Zarvān | Adaptive Reversal SmartView
Detects nuanced phase transitions, emerging reversals, and the “pulse” of the trend—well before classic indicators react.
MACD-Zarvān (Normalized)
An advanced, context-aware MACD, normalized and dynamically weighted by field conditions for vastly improved divergence detection.
Why Trust These Tools?
Noise Resistant: Zarvān indicators filter out “fake” moves and sideways traps, reacting only to truly significant field events.
Energy-Focused: Rather than just price or volume, they assess the interplay of forces behind every market move.
Signal Selectivity: Alerts are only generated when the underlying field energy and trend conditions truly align.
Practical Takeaway:
While price remains inside the highlighted decision zone, patience is advised. A confirmed breakout in either direction, validated by Zarvān indicators, can offer high-quality trading opportunities.
Set alerts at the levels above and wait for a clean setup.
Probability Outlook:
Given the current market structure and the price’s position within the decision zone, the probability of an upward move is slightly higher at this point. Both bullish and bearish scenarios remain valid, but recent price action—together with subtle positive divergence signals detected by proprietary Zarvān indicators—shifts the balance modestly in favor of the bulls.
At present, I estimate the odds at roughly 55% bullish versus 45% bearish.
This analysis is powered by Zarvān Field Intelligence. Our indicators are proprietary and developed exclusively for advanced phase-field market research. Please do not redistribute or copy our logic without permission.
Powered by Zarvān | Dynamic Field S/R Engine
ADA/USDT is now trading inside a crucial decision zone, highlighted by the golden background on the chart. This area marks a period of market indecision—typically a precursor to a strong breakout move in either direction.
- Key Technical Levels:
Dynamic Support: 0.6580 – If this level fails, watch for the next support at 0.6430, and, in extension, 0.6225.
Dynamic Resistance: 0.6991 – This is the key short-term resistance. A confirmed breakout here opens the path towards 0.7540 and potentially 0.7851.
Major Resistance: 0.7997
Potential Scenarios:
Bullish Outlook:
Should ADA/USDT decisively break and hold above 0.6991, a rapid move towards 0.7540—and possibly higher to 0.7851—is on the table. (Green projection on chart)
Bearish Outlook:
Conversely, losing the 0.6580 support level could trigger a drop to 0.6430, then 0.6225. (Red projection)
What Makes This Analysis Unique?
This forecast is built upon a suite of proprietary Zarvān indicators, not available to the general public. These include:
Zarvān | Dynamic Support & Resistance (Divergence-Based)
A smart, adaptive S/R system built on divergence, structural bias, and market energy—not simple pivots or Fibonacci retracements.
Zarvān | Composite Field Engine
Measures “hidden field energy,” imbalance, and latent reversal potential using a layered logic unique to the Zarvān methodology.
Zarvān | Adaptive Reversal SmartView
Detects nuanced phase transitions, emerging reversals, and the “pulse” of the trend—well before classic indicators react.
MACD-Zarvān (Normalized)
An advanced, context-aware MACD, normalized and dynamically weighted by field conditions for vastly improved divergence detection.
Why Trust These Tools?
Noise Resistant: Zarvān indicators filter out “fake” moves and sideways traps, reacting only to truly significant field events.
Energy-Focused: Rather than just price or volume, they assess the interplay of forces behind every market move.
Signal Selectivity: Alerts are only generated when the underlying field energy and trend conditions truly align.
Practical Takeaway:
While price remains inside the highlighted decision zone, patience is advised. A confirmed breakout in either direction, validated by Zarvān indicators, can offer high-quality trading opportunities.
Set alerts at the levels above and wait for a clean setup.
Probability Outlook:
Given the current market structure and the price’s position within the decision zone, the probability of an upward move is slightly higher at this point. Both bullish and bearish scenarios remain valid, but recent price action—together with subtle positive divergence signals detected by proprietary Zarvān indicators—shifts the balance modestly in favor of the bulls.
At present, I estimate the odds at roughly 55% bullish versus 45% bearish.
This analysis is powered by Zarvān Field Intelligence. Our indicators are proprietary and developed exclusively for advanced phase-field market research. Please do not redistribute or copy our logic without permission.
Note
I’m not here to hand out buy/sell signals. My goal is to help you perceive and understand the deeper “field” that shapes market movement—beyond simple indicators or triggers. The Zarvān approach is all about reading the energy, tension, and subtle rhythms beneath the surface, so you can make decisions from a place of real insight, not just reaction.Note
Zarvān support and resistance levels operate with high precision.Disclaimer
The information and publications are not meant to be, and do not constitute, financial, investment, trading, or other types of advice or recommendations supplied or endorsed by TradingView. Read more in the Terms of Use.
Disclaimer
The information and publications are not meant to be, and do not constitute, financial, investment, trading, or other types of advice or recommendations supplied or endorsed by TradingView. Read more in the Terms of Use.