Technical Analysis for #ADA/USDT:
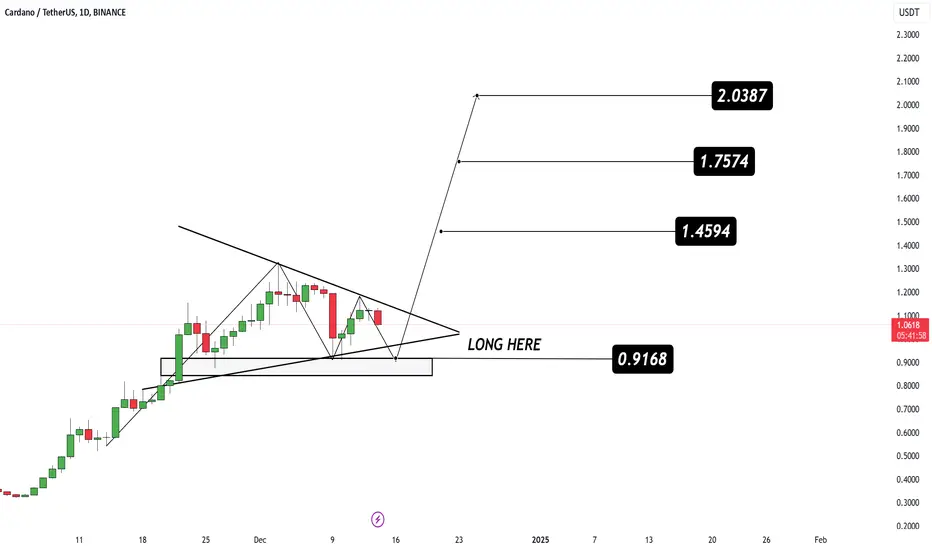
 ADA The daily chart indicates the formation of a symmetrical triangle, suggesting a potential breakout in the bullish direction. The current price at $1.059 is near the lower support zone. Key support lies at $0.9168, presenting an ideal buying opportunity. Projected targets after the breakout are $1.4594, $1.7574, and $2.0387. Traders are advised to set a stop loss below $0.89 for risk management.
Subscribe to my Telegram Channel 👉 :
t.me/addlist/y5mi70s3c0Y3MDQ0
Subscribe to my X 👉 : x.com/VIPROSETR
t.me/addlist/y5mi70s3c0Y3MDQ0
Subscribe to my X 👉 : x.com/VIPROSETR
Disclaimer
The information and publications are not meant to be, and do not constitute, financial, investment, trading, or other types of advice or recommendations supplied or endorsed by TradingView. Read more in the Terms of Use.