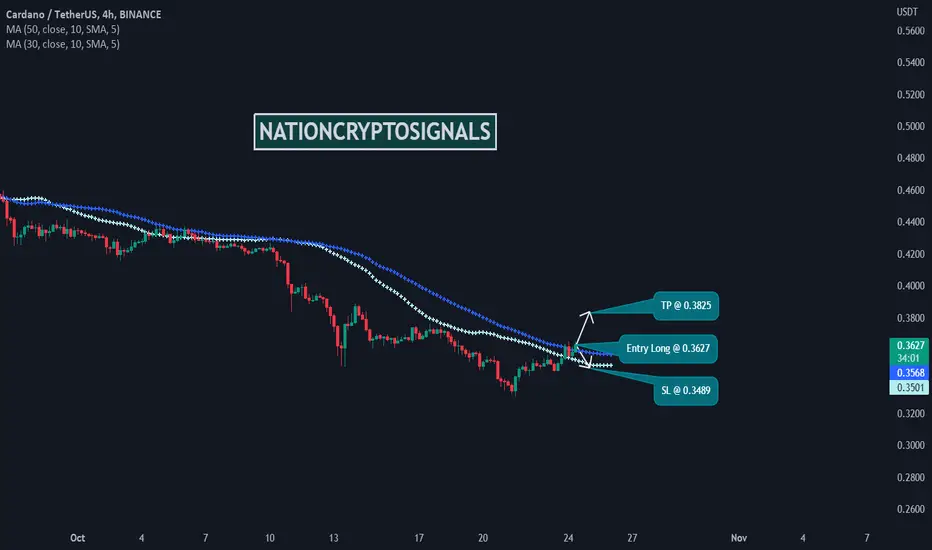
Time Frame: 4H
Symbol: ADAUSDT
Entry: 0.3627
TP: 0.3825
SL: 0.3489
Bias: Long
The study of dynamic support and resistance displays a narrow range and the price is oscillating between two extremes but the volatility factor is low. That is why we cannot expect a high potential trade from the current price context. Considering the price pattern we can expect some price move from support to resistance and resistance to support.
Disclaimer
The information and publications are not meant to be, and do not constitute, financial, investment, trading, or other types of advice or recommendations supplied or endorsed by TradingView. Read more in the Terms of Use.
Disclaimer
The information and publications are not meant to be, and do not constitute, financial, investment, trading, or other types of advice or recommendations supplied or endorsed by TradingView. Read more in the Terms of Use.