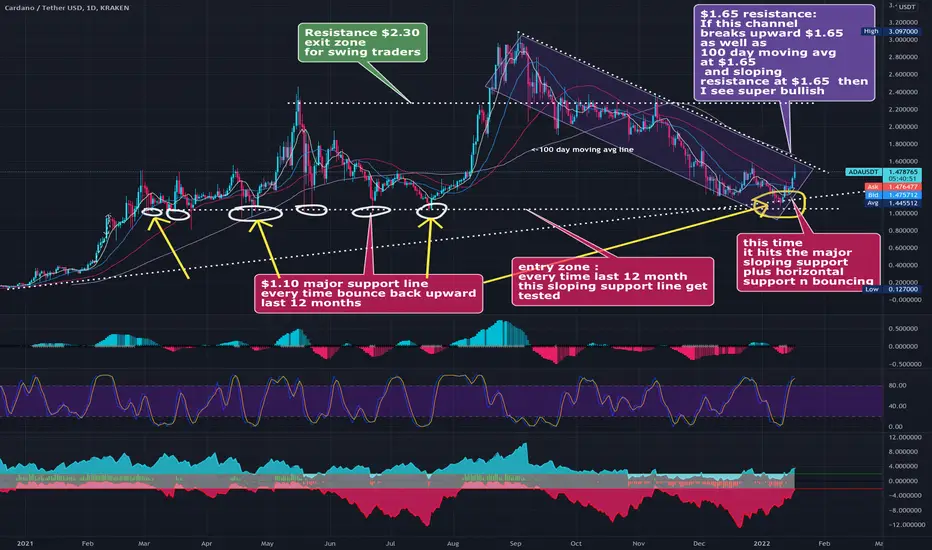
1) Daily chart 12 month horizon chart
2) $1.10 major support line every time it bounce back upward since 12 months (entry zone )
3) $1.65 resistance if this channel breaks bullish
4) 100 day moving avg $1.65 breaks bullish sign
5) sloping resistance breaks $1.65 bullish sign
6) Exit zone $2.30 resistance
7) this chart is for educational purpose only not a financial advise.
Disclaimer
The information and publications are not meant to be, and do not constitute, financial, investment, trading, or other types of advice or recommendations supplied or endorsed by TradingView. Read more in the Terms of Use.
Disclaimer
The information and publications are not meant to be, and do not constitute, financial, investment, trading, or other types of advice or recommendations supplied or endorsed by TradingView. Read more in the Terms of Use.