Cardano's Ascent: A Technical Outlook for Q3-Q4 2025
Breaking Through Resistance: Cardano's Path to $1.00 and Beyond
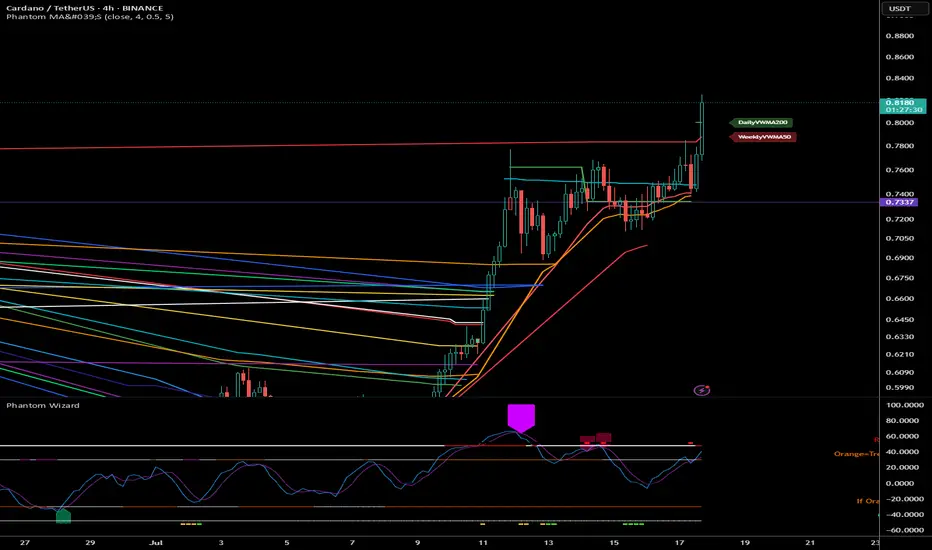
Following a period of extended consolidation, Cardano (ADA) has demonstrated a significant shift in character, breaking out decisively from a key resistance zone. Currently trading near $0.82 as of July 18, 2025, ADA has entered a new phase of bullish momentum. This analysis will dissect the technical landscape to project its potential trajectory through the end of the year, identifying critical price levels and probable targets.
Current Market Context
After consolidating in a range between $0.70 and $0.77 for several weeks, ADA has executed a powerful breakout, surging over 15% in the last few days to establish a multi-month high at $0.825. This move signals a clear victory for buyers and a potential end to the preceding sideways market structure. The immediate challenge for bulls is to defend this breakout level and convert prior resistance into firm support, setting the stage for the next major leg higher.
RSI Analysis: Emerging Strength with Room to Run
The recent price surge has propelled the daily Relative Strength Index (RSI) into overbought territory, currently reading above 70. While this often signals a short-term exhaustion and suggests a minor pullback or consolidation is likely, the underlying momentum on higher timeframes remains constructive.
The weekly RSI is trending sharply upwards from the neutral 50-level but remains well below the extreme overbought readings (80+) that have historically marked major cycle tops for ADA. This divergence between short-term overbought conditions and long-term momentum capacity is a classic sign of a healthy, strengthening trend. It indicates that while a brief pause is probable, the primary path of least resistance remains upward for the coming months.
Price Action & Volume Analysis: The Anatomy of a Breakout
The price action leading up to this point exhibits classic signs of accumulation followed by a markup phase:
Accumulation Phase: The trading range between $0.70 and $0.77 showed contracting volatility and was likely a period of "cause-building," where informed market participants accumulated positions.
Sign of Strength (SOS): The recent impulsive move from $0.77 to over $0.82 represents a clear SOS. This breakout was likely accompanied by a significant increase in volume, confirming the market's conviction and overwhelming sellers who were active at the resistance level.
A successful retest of the breakout zone at $0.75 - $0.77 on diminishing volume would be the strongest possible confirmation of a new, sustainable uptrend.
Supply and Demand Zone Analysis: Charting the Path Forward
The recent breakout has fundamentally altered the market structure, turning a key supply zone into a new floor of demand.
Major Demand Zone (New Support): A critical demand zone has now been established between $0.75 - $0.77. This area, formerly resistance, is now the most important level for bulls to defend to maintain the bullish structure.
Secondary Support Cluster: Should the primary zone fail, the next significant support lies at $0.68 - $0.70, the floor of the previous accumulation range.
Overhead Supply Zones: Unlike an asset at all-time highs, ADA faces historical resistance. The next major supply zones are located near $0.95 and, more significantly, the psychological and technical barrier at $1.10 - $1.15.
Fibonacci Extension Framework: Projecting Bullish Targets
Using the recent swing low of the accumulation phase (approx. $0.70) and the recent swing high ($0.825), we can project logical price targets for the current impulse wave:
The 127.2% extension projects a target of approximately $0.88.
The 161.8% extension, a common target for strong trends, points toward $0.92.
A more extended move to the 200% extension suggests a potential test of $0.97, aligning closely with the psychological $1.00 level.
These Fibonacci-derived targets provide a clear roadmap for the potential upside if the current bullish momentum is sustained.
Price Projection Timeline
Late July - August 2025:
Expect a period of consolidation or a healthy pullback. The overbought daily RSI suggests the market needs to pause. A retest of the $0.77 support level would be a prime opportunity for trend-continuation entries. A successful defence of this zone is critical.
September - October 2025:
Following the consolidation, the trend is expected to resume, targeting the Fibonacci extension levels of $0.88 - $0.92. This move would represent the confirmation of the new uptrend and would likely attract a second wave of buyers.
November - December 2025:
Should the Q4 market environment remain favourable, a push toward the major psychological and technical resistance at $1.00 - $1.15 is highly probable. This would represent a significant milestone and could trigger a more substantial corrective phase as long-term holders take profits.
Support Zones:
Primary: $0.75 - $0.77 (The breakout point; must hold)
Secondary: $0.68 - $0.70 (Floor of the previous range)
Resistance & Target Zones:
Immediate: $0.825 (Recent high)
Target 1: $0.88 - $0.92 (Fibonacci cluster)
Target 2: $0.97 - $1.00 (Fibonacci & psychological level)
Major Resistance: $1.10 - $1.15 (Historical supply zone)
Conclusion: The Road to One Dollar
The technical evidence strongly suggests that Cardano has initiated a new bullish impulse wave. The breakout from its multi-week consolidation range is a significant technical event that has shifted the market bias firmly in favour of the bulls. While a short-term pullback to retest the breakout level around $0.77 is a high probability, this would likely serve as a healthy reset before the next major advance.
Based on the confluence of price action, momentum analysis, and Fibonacci projections, a move toward the $0.95 - $1.15 range is a realistic objective for Cardano by the end of 2025.
Breaking Through Resistance: Cardano's Path to $1.00 and Beyond
Following a period of extended consolidation, Cardano (ADA) has demonstrated a significant shift in character, breaking out decisively from a key resistance zone. Currently trading near $0.82 as of July 18, 2025, ADA has entered a new phase of bullish momentum. This analysis will dissect the technical landscape to project its potential trajectory through the end of the year, identifying critical price levels and probable targets.
Current Market Context
After consolidating in a range between $0.70 and $0.77 for several weeks, ADA has executed a powerful breakout, surging over 15% in the last few days to establish a multi-month high at $0.825. This move signals a clear victory for buyers and a potential end to the preceding sideways market structure. The immediate challenge for bulls is to defend this breakout level and convert prior resistance into firm support, setting the stage for the next major leg higher.
RSI Analysis: Emerging Strength with Room to Run
The recent price surge has propelled the daily Relative Strength Index (RSI) into overbought territory, currently reading above 70. While this often signals a short-term exhaustion and suggests a minor pullback or consolidation is likely, the underlying momentum on higher timeframes remains constructive.
The weekly RSI is trending sharply upwards from the neutral 50-level but remains well below the extreme overbought readings (80+) that have historically marked major cycle tops for ADA. This divergence between short-term overbought conditions and long-term momentum capacity is a classic sign of a healthy, strengthening trend. It indicates that while a brief pause is probable, the primary path of least resistance remains upward for the coming months.
Price Action & Volume Analysis: The Anatomy of a Breakout
The price action leading up to this point exhibits classic signs of accumulation followed by a markup phase:
Accumulation Phase: The trading range between $0.70 and $0.77 showed contracting volatility and was likely a period of "cause-building," where informed market participants accumulated positions.
Sign of Strength (SOS): The recent impulsive move from $0.77 to over $0.82 represents a clear SOS. This breakout was likely accompanied by a significant increase in volume, confirming the market's conviction and overwhelming sellers who were active at the resistance level.
A successful retest of the breakout zone at $0.75 - $0.77 on diminishing volume would be the strongest possible confirmation of a new, sustainable uptrend.
Supply and Demand Zone Analysis: Charting the Path Forward
The recent breakout has fundamentally altered the market structure, turning a key supply zone into a new floor of demand.
Major Demand Zone (New Support): A critical demand zone has now been established between $0.75 - $0.77. This area, formerly resistance, is now the most important level for bulls to defend to maintain the bullish structure.
Secondary Support Cluster: Should the primary zone fail, the next significant support lies at $0.68 - $0.70, the floor of the previous accumulation range.
Overhead Supply Zones: Unlike an asset at all-time highs, ADA faces historical resistance. The next major supply zones are located near $0.95 and, more significantly, the psychological and technical barrier at $1.10 - $1.15.
Fibonacci Extension Framework: Projecting Bullish Targets
Using the recent swing low of the accumulation phase (approx. $0.70) and the recent swing high ($0.825), we can project logical price targets for the current impulse wave:
The 127.2% extension projects a target of approximately $0.88.
The 161.8% extension, a common target for strong trends, points toward $0.92.
A more extended move to the 200% extension suggests a potential test of $0.97, aligning closely with the psychological $1.00 level.
These Fibonacci-derived targets provide a clear roadmap for the potential upside if the current bullish momentum is sustained.
Price Projection Timeline
Late July - August 2025:
Expect a period of consolidation or a healthy pullback. The overbought daily RSI suggests the market needs to pause. A retest of the $0.77 support level would be a prime opportunity for trend-continuation entries. A successful defence of this zone is critical.
September - October 2025:
Following the consolidation, the trend is expected to resume, targeting the Fibonacci extension levels of $0.88 - $0.92. This move would represent the confirmation of the new uptrend and would likely attract a second wave of buyers.
November - December 2025:
Should the Q4 market environment remain favourable, a push toward the major psychological and technical resistance at $1.00 - $1.15 is highly probable. This would represent a significant milestone and could trigger a more substantial corrective phase as long-term holders take profits.
Support Zones:
Primary: $0.75 - $0.77 (The breakout point; must hold)
Secondary: $0.68 - $0.70 (Floor of the previous range)
Resistance & Target Zones:
Immediate: $0.825 (Recent high)
Target 1: $0.88 - $0.92 (Fibonacci cluster)
Target 2: $0.97 - $1.00 (Fibonacci & psychological level)
Major Resistance: $1.10 - $1.15 (Historical supply zone)
Conclusion: The Road to One Dollar
The technical evidence strongly suggests that Cardano has initiated a new bullish impulse wave. The breakout from its multi-week consolidation range is a significant technical event that has shifted the market bias firmly in favour of the bulls. While a short-term pullback to retest the breakout level around $0.77 is a high probability, this would likely serve as a healthy reset before the next major advance.
Based on the confluence of price action, momentum analysis, and Fibonacci projections, a move toward the $0.95 - $1.15 range is a realistic objective for Cardano by the end of 2025.
Discord.gg/CryptoIndicators
Disclaimer
The information and publications are not meant to be, and do not constitute, financial, investment, trading, or other types of advice or recommendations supplied or endorsed by TradingView. Read more in the Terms of Use.
Discord.gg/CryptoIndicators
Disclaimer
The information and publications are not meant to be, and do not constitute, financial, investment, trading, or other types of advice or recommendations supplied or endorsed by TradingView. Read more in the Terms of Use.