🧠 Detailed Technical Analysis:
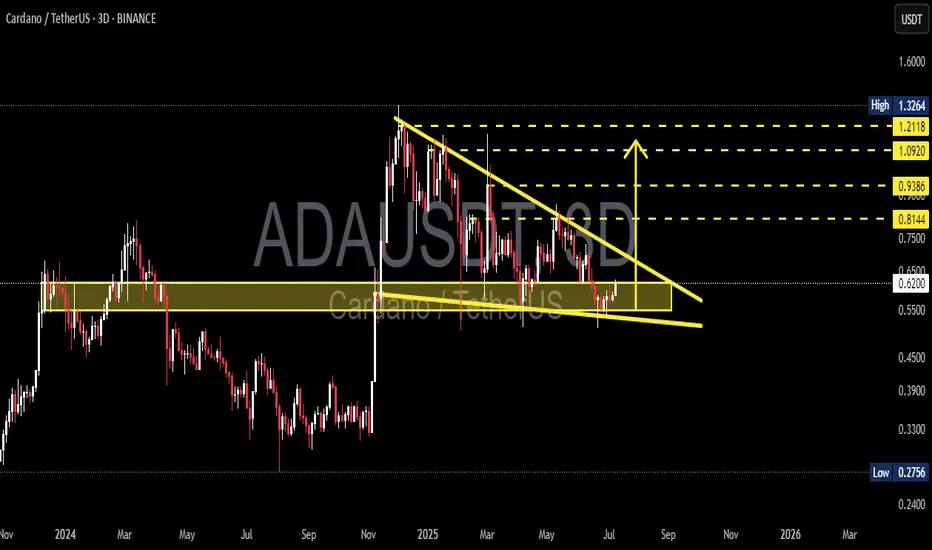
Cardano (ADA) is currently consolidating within a well-defined Symmetrical Triangle pattern on the 3-day chart. This pattern is formed by a series of lower highs and higher lows, indicating compression and indecision in the market — a classic setup for a strong breakout in either direction.
Price has recently bounced off the lower boundary of the triangle and is now heading toward the resistance trendline. A breakout from this structure could trigger a powerful bullish move if confirmed with volume.
🔼 Bullish Scenario (Upside Breakout):
A confirmed breakout above the descending trendline (~$0.65) with strong volume would indicate buyers regaining control.
Key upside targets based on historical resistance zones and the triangle's height:
🟡 $0.8144 – First major horizontal resistance
🟡 $0.9386 – Mid-range resistance from March 2025
🟡 $1.0920 – Former distribution zone
🟡 $1.2118 – Medium-term bullish target
🔵 $1.3264 – Key structural high from previous cycle
🔔 A breakout from a symmetrical triangle often leads to significant price action due to the long period of coiled pressure release.
🔽 Bearish Scenario (Breakdown):
If ADA fails to break above $0.62–$0.65 and gets rejected from the upper boundary of the triangle, the price could:
Revisit the lower trendline support around $0.55
A breakdown below this zone could lead to:
🔻 $0.48
🔻 $0.39
🔻 $0.2756 – A major psychological and historical support level
⚠️ This scenario would invalidate the bullish structure and potentially resume the mid-term downtrend.
📐 Pattern Breakdown – Symmetrical Triangle:
Pattern Duration: ~6 months of consolidation (Feb – July 2025)
Support Zone: $0.55 – $0.60
Resistance Zone: $0.65 – $0.75
Breakout Confirmation: Requires strong bullish candle close with increased volume
Volume Profile: Decreasing, typical of symmetrical triangle before explosive move
💡 Final Thoughts:
Cardano is at a make-or-break point. It has bounced from support and is attempting a breakout from this symmetrical triangle. If successful, this could mark the beginning of a major trend reversal with over +100% upside potential from current levels.
On the flip side, failure to break resistance could lead to a deeper retracement. That’s why confirmation is critical before entering a position!
#ADAUSDT #CardanoAnalysis #CryptoBreakout #SymmetricalTriangle #AltcoinSeason #BullishBreakout #BearishScenario #TechnicalAnalysis #CryptoChart #CryptoTrading #Altcoins
✅ Get Free Signals! Join Our Telegram Channel Here: t.me/TheCryptoNuclear
✅ Twitter: twitter.com/crypto_nuclear
✅ Join Bybit : partner.bybit.com/b/nuclearvip
✅ Benefits : Lifetime Trading Fee Discount -50%
✅ Twitter: twitter.com/crypto_nuclear
✅ Join Bybit : partner.bybit.com/b/nuclearvip
✅ Benefits : Lifetime Trading Fee Discount -50%
Disclaimer
The information and publications are not meant to be, and do not constitute, financial, investment, trading, or other types of advice or recommendations supplied or endorsed by TradingView. Read more in the Terms of Use.