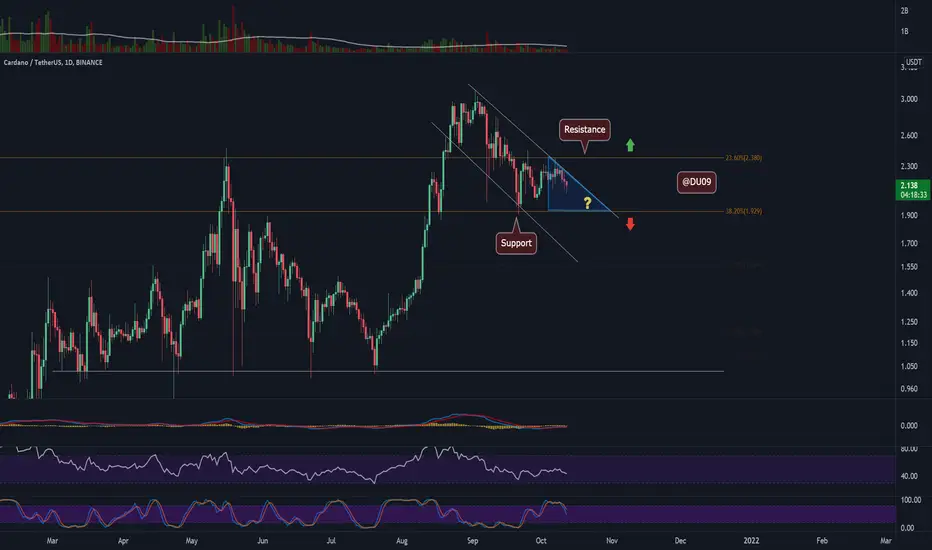
Support level: $1.9
Resistance level: $2.4
ADA is in a corrective pattern within a large downtrend channel. Price will likely re-test support at $1.9 before any uptrend will resume. This channel can also be interpreted as a bullish flag, but for that to confirm, we need to break above it and make it support. If that happens our next key resistance is at $2.4.
Indicators:
Bias:
Bearish so long we remain in the channel and we fail to break out of it. On weekly timeframe, ADA just did a bearish cross on MACD. This may indicate we will have a bearish trend for some time, particularly if we break under our $1.9 support. Be cautious on taking any longs for that reason and use tight stop losses. Don’t exclude a bounce towards $2.4 if price breaks above this channel, however once there price can be pushed lower again in line with the weekly MACD which remains bearish.
Price prediction for ADA:
Considering ADA had a massive pump this summer to $3, it now finds itself in a correction. This may last a while, so don’t rush to buy until we have good confirmation of a new up-trend. Breaking above our downtrend channel would be a good start towards that at which point we can set some good targets. Right now $2.4 is your best bet.
Like and follow if you liked this idea!
Resistance level: $2.4
ADA is in a corrective pattern within a large downtrend channel. Price will likely re-test support at $1.9 before any uptrend will resume. This channel can also be interpreted as a bullish flag, but for that to confirm, we need to break above it and make it support. If that happens our next key resistance is at $2.4.
Indicators:
- Volume: Mostly flat and waning. If this continues, the strength of this downtrend will weaken and allow for a reversal once we approach support.
- RSI: Falling on daily timeframe, therefore, the short term view is bearish. Wait for a reversal before considering an entry, particularly once we approach support.
- MACD: Losing strength on daily timeframe and likely to cross on the negative side in the next day or two. Do not enter a long here so long we’re in the channel.
Bias:
Bearish so long we remain in the channel and we fail to break out of it. On weekly timeframe, ADA just did a bearish cross on MACD. This may indicate we will have a bearish trend for some time, particularly if we break under our $1.9 support. Be cautious on taking any longs for that reason and use tight stop losses. Don’t exclude a bounce towards $2.4 if price breaks above this channel, however once there price can be pushed lower again in line with the weekly MACD which remains bearish.
Price prediction for ADA:
Considering ADA had a massive pump this summer to $3, it now finds itself in a correction. This may last a while, so don’t rush to buy until we have good confirmation of a new up-trend. Breaking above our downtrend channel would be a good start towards that at which point we can set some good targets. Right now $2.4 is your best bet.
Like and follow if you liked this idea!
📣 Find more Alpha by joining Your Crypto Community 🔰 LINKs BELOW 🔰
🔹 Over 5,000 members!
🔹 Real trades & wins explained
🔹 Trading ideas, crypto trends & alpha
Likes and follows appreciated! 🚀
🔹 Over 5,000 members!
🔹 Real trades & wins explained
🔹 Trading ideas, crypto trends & alpha
Likes and follows appreciated! 🚀
Related publications
Disclaimer
The information and publications are not meant to be, and do not constitute, financial, investment, trading, or other types of advice or recommendations supplied or endorsed by TradingView. Read more in the Terms of Use.