Hello, dear HODLers!
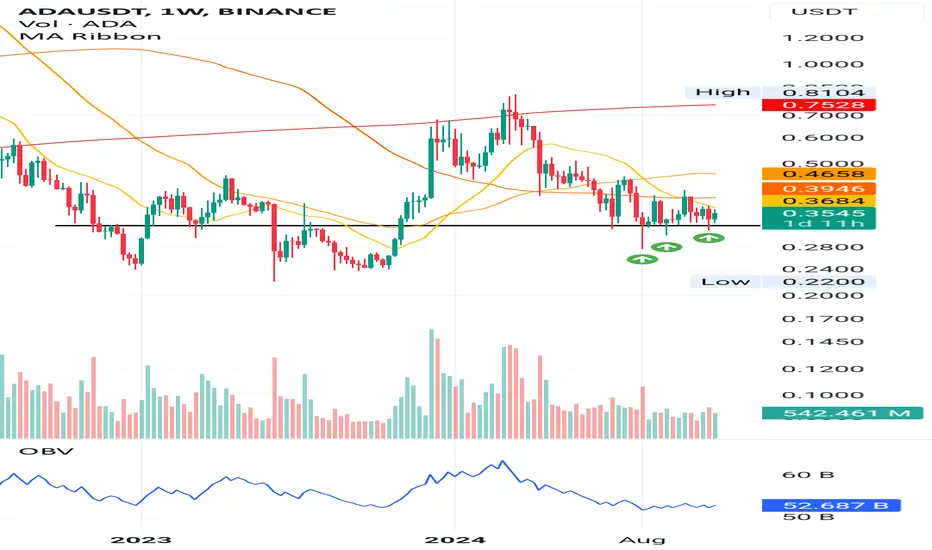
This is ADAUSDT on the weekly timeframe. The black line has been a significant level since October 2022, shifting between support and resistance for over two years. In 2024, it began acting as support starting in the first week of July.
Since then, the wicks below this level have started getting shorter, suggesting that selling pressure might be weakening. This level could mark the beginning of the next bull run. If we see another dip that holds with an even shorter wick, I would consider it a confirmation.
Stay safe, and feel free to leave any comments or questions.
Thanks for reading!
Trade active
Seven days ago, the support level was put to the test, and today we can clearly see it’s holding. However, I would have preferred to see more volume on this weekly bar.Disclaimer
The information and publications are not meant to be, and do not constitute, financial, investment, trading, or other types of advice or recommendations supplied or endorsed by TradingView. Read more in the Terms of Use.
Disclaimer
The information and publications are not meant to be, and do not constitute, financial, investment, trading, or other types of advice or recommendations supplied or endorsed by TradingView. Read more in the Terms of Use.