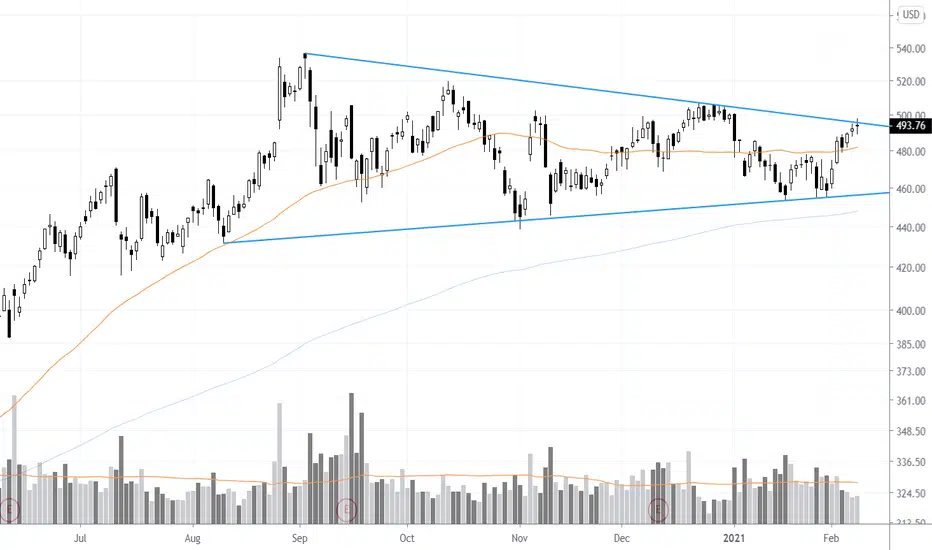
Adobe has been moving sideways in the last 5+ months forming a symmetrical triangle pattern . The stock has been in hibernation similar to  NVDA but that was not the case from 2011 to 2020 when the stock had a 2230+% run! A breakout from the 5 months symmetrical triangle to the upside could signal the end of this consolidation phase and the start of yet another leg higher.
✔ Momentum & Breakout Trader Since 2006 | Influenced by Mark Minervini VCP Trading Style & William O'Neil CANSLIM 📈
✔ Follow me on Twitter @taplot - twitter.com/TaPlot
✔ YouTube channel youtube.com/@taplot
✔ Follow me on Twitter @taplot - twitter.com/TaPlot
✔ YouTube channel youtube.com/@taplot
Disclaimer
The information and publications are not meant to be, and do not constitute, financial, investment, trading, or other types of advice or recommendations supplied or endorsed by TradingView. Read more in the Terms of Use.